
Figures & data
Figure 1. Comparing the levels of trace elements before and after treatment in the severe bronchiolitis group and control group (mg/L).
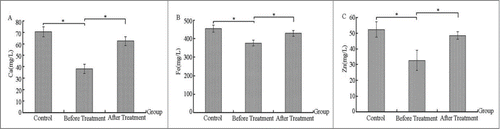
Figure 2. Comparing the levels of T-cell subsets before and after treatment in the severe bronchiolitis group and control group (%).
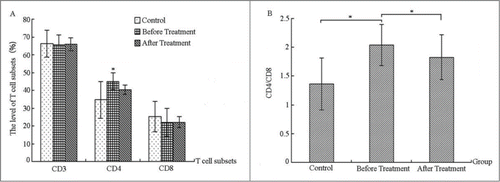
Figure 3. Comparing the levels of serum immunoglobulin before and after treatment in the severe bronchiolitis group and control group (g/L).
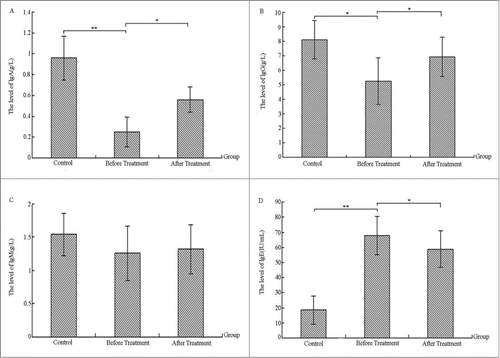
Figure 4. Comparing the levels of serum inflammatory cytokines before and after treatment in the severe bronchiolitis group and control group (g/L).
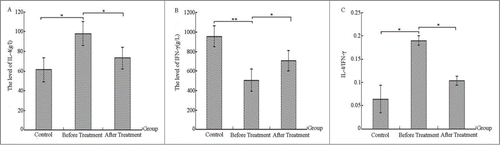
Table 1. Comparing the disappeared time of clinical symptoms and signs