Figures & data
Table 1. Model input parameter values and ranges.
Table 2. Result of the cost effectiveness analysis for a cohort of 1231735 children born in 2009 in Iran.
Figure 1. The decision tree model. In this figure patient follow is shown. The first node represents the decision between the not vaccinated and vaccinated strategy (displayed as square). After the decision node a Markov node follows, where possible Markov-states are defined.
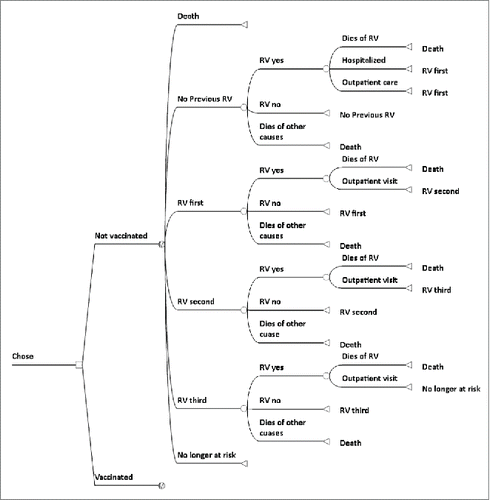
Figure 2. Results of one-way sensitivity analyses. This graph presents results of univariate sensitivity analyses from the health care (A) and societal perspective (B). The x-axis represents the ranges of the incremental cost-effectiveness ratios of vaccination in Iranian children when the baseline estimates of key parameters were varied over plausible ranges. The vertical line represents the base case incremental cost-effectiveness ratio of rotavirus vaccination. The negative values indicate saving per averted DALY.
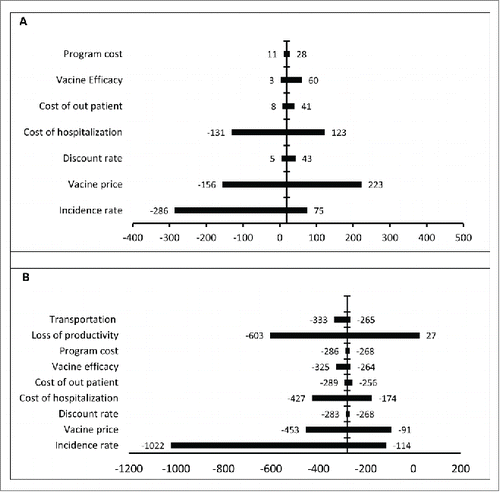
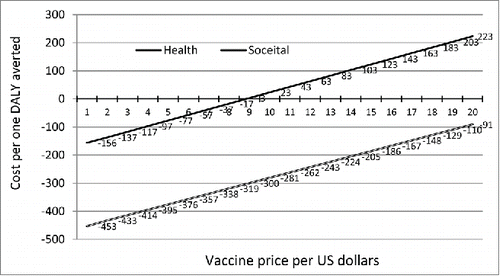
Figure 3. The incremental cost- effectiveness ratio (ICER) for different price of vaccine from both health care and societal perspective.