Figures & data
Table 1. Adjuvant characterization results.
Table 2. Antigen characterization results.
Figure 1. Flow diagram of antigen manufacturing processes employed by CI with corresponding preclinical studies which employed the antigens, with changes highlighted in orange shading. The process used to manufacture the Sanofi Pasteur H5N1 vaccine, used in Mouse Exp 3 and Ferret Exp 1, was similar to Process Z according to Treanor et al. New Eng J Med 2006, 354:1343 as well as the package insert.
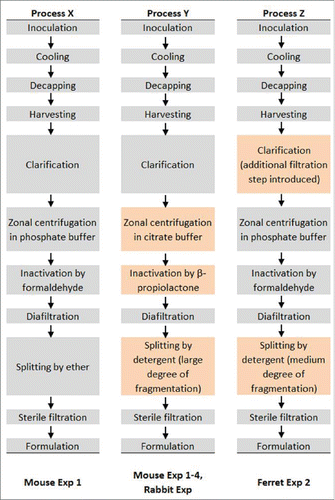
Figure 2. H5N1 antigens manufactured by different processes elicit comparable immunogenicity in mice, but effect of adjuvant is not apparent at antigen dose of 3 μg. H5N1 and H1N1 antigens were manufactured by Process X (H5N1-X, H1N1-X) or Process Y (H5N1-Y). Groups of 15 female BALB/c mice were immunized i.m. on Day 0 and Day 21 with PBS, antigen alone (3 μg), or antigen (3 μg) + SE. HI titers for 8–15 mice were measured on Day 20 (a), Day 28 (b), Day 42 (c), and Day 62 (d). Multiple comparisons between groups were analyzed by one-way ANOVA with Tukey's correction, #p<0.05 H5N1-X vs. H5N1-Y. The data are shown as box and whisker plots, with whiskers representing the minimum and maximum values.
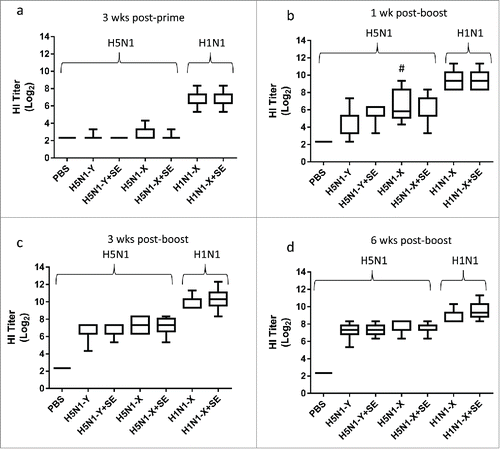
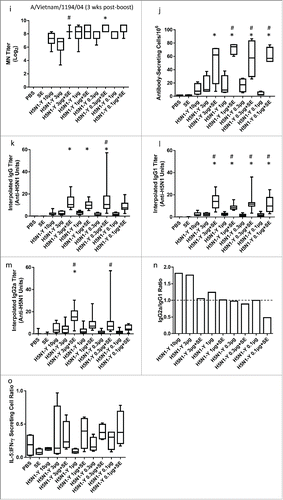
Figure 3. SE facilitates enhanced HI, MN, IgG, and long-lived plasma cell responses and antigen dose sparing. H5N1 antigen was manufactured by Process Y (H5N1-Y). Groups of 15 female BALBc mice were immunized i.m. on Day 0 and Day 21 with PBS, antigen alone, SE alone, or antigen + SE at the antigen doses indicated. Except as noted, serum HI titers were measured by CI using turkey RBCs from 11--15 mice per group on Day 28 against the homologous strain (a), on Day 28 against the heterologous A/turkey/Turkey/1/2005 strain (b), on Day 42 against the homologous strain (c), on Day 42 against the homologous strain using horse RBCs at the Southern Research Institute (SRI) (d), and on Day 42 against the heterologous A/turkey/Turkey/1/2005 strain (e). MN titers were measured from 8--15 mice per group (except for the negative controls) on Day 28 against the homologous (f) and heterologous (g) strains or on Day 42 against the homologous (h) and heterologous (i) strains. Long-lived antibody-secreting plasma cells determined by ELISPOT (j), antibody titers determined by ELISA and interpolated from a standard curve for IgG (k), IgG1 (l), and IgG2a (m), including the calculated IgG2/aIgG1 ratio (n), and the ratio of IL-5-secreting cells:IFNγ-secreting cells determined by ELISPOT (o) were all measured on Day 42. ELISPOT assays employed 4 mice per group whereas antibody ELISA assays were for 9--13 mice with samples below detection assigned a value of zero. Multiple comparisons between groups were analyzed by one-way ANOVA with Tukey's correction, *p < 0.05 vs. H5N1-Y (10 μg), #p < 0.05 vs. same antigen dose without adjuvant. The data in (a-m, o) are shown as box and whisker plots, with whiskers representing the minimum and maximum values. The columns in (n) represent grouped average ratios.
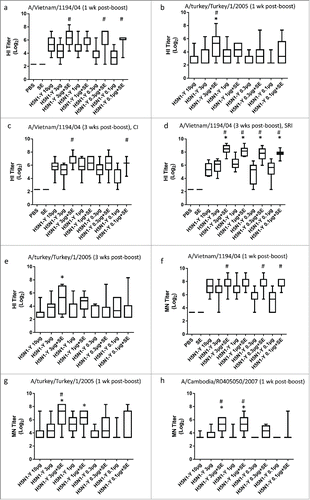
Figure 4. Adjuvanted H5N1 vaccines from different manufacturers elicit enhanced HI titers from immunized mice regardless of antigen or adjuvant manufacturer or composition. H5N1 antigen was manufactured by CI using Process Y (H5N1-Y) or by Sanofi Pasteur (H5N1-S) using a process similar to Process Z. Groups of 10 female BALB/c mice were immunized i.m. on Day 0 and Day 21 with PBS, antigen alone (1 or 0.1 μg), or antigen + emulsion adjuvant (SE manufactured by CI, SE manufactured by IDRI, or EM022 manufactured by IDRI). HI titers were measured by CI from all 10 mice from each group on Day 28 (a-c) or Day 42 (d-f) using horse RBCs. HI titers against the homologous strain (a,d) or heterologous strains (A/turkey/Turkey/1/2005[b,e] or A/Cambodia/R0405050/2007[c,f]) were measured. Multiple comparisons between groups were analyzed by one-way ANOVA with Tukey's correction, *p < 0.05 vs. H5N1-Y (1 μg and 0.1 μg) or H5N1-S (1 μg and 0.1 μg). The data are shown as box and whisker plots, with whiskers representing the minimum and maximum values.
![Figure 4. Adjuvanted H5N1 vaccines from different manufacturers elicit enhanced HI titers from immunized mice regardless of antigen or adjuvant manufacturer or composition. H5N1 antigen was manufactured by CI using Process Y (H5N1-Y) or by Sanofi Pasteur (H5N1-S) using a process similar to Process Z. Groups of 10 female BALB/c mice were immunized i.m. on Day 0 and Day 21 with PBS, antigen alone (1 or 0.1 μg), or antigen + emulsion adjuvant (SE manufactured by CI, SE manufactured by IDRI, or EM022 manufactured by IDRI). HI titers were measured by CI from all 10 mice from each group on Day 28 (a-c) or Day 42 (d-f) using horse RBCs. HI titers against the homologous strain (a,d) or heterologous strains (A/turkey/Turkey/1/2005[b,e] or A/Cambodia/R0405050/2007[c,f]) were measured. Multiple comparisons between groups were analyzed by one-way ANOVA with Tukey's correction, *p < 0.05 vs. H5N1-Y (1 μg and 0.1 μg) or H5N1-S (1 μg and 0.1 μg). The data are shown as box and whisker plots, with whiskers representing the minimum and maximum values.](/cms/asset/ec2eb7bf-6f0b-4a5f-a60b-dbb2659f30b3/khvi_a_1111495_f0004_b.gif)
Figure 5. H5N1 vaccine with SE adjuvant induces enhanced HI titers and antigen dose sparing in immunized rabbits. H5N1 antigen was manufactured by CI using Process Y (H5N1-Y). Groups of 5 male New Zealand white rabbits were immunized i.m. on Day 0 and Day 21 with PBS, antigen alone (15 μg), or antigen (15, 7.5, or 3.75 μg) + emulsion adjuvant. HI titers against the homologous strain were measured using horse RBCs from all 5 rabbits from each group on Day 21 (a), Day 28 (b), Day 42 (c), or Day 63 (d). Multiple comparisons between groups were analyzed by one-way ANOVA with Tukey's correction, *p < 0.05 vs. H5N1-Y (15 μg). The data are shown as box and whisker plots, with whiskers representing the minimum and maximum values.
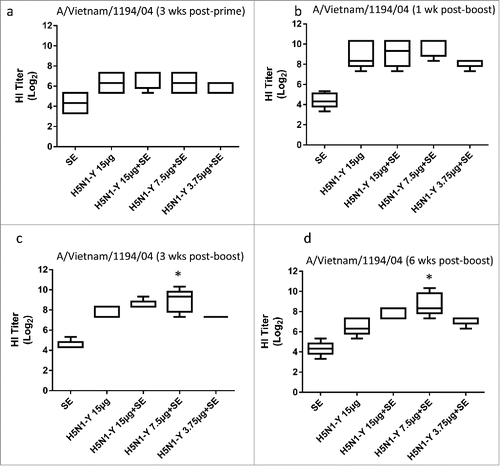
Figure 6. Ferrets immunized with adjuvanted H5N1 manufactured by Sanofi (H5N1-S) demonstrate enhanced protection from homologous challenge. (a) Percent survival following challenge. (b) Average clinical score for each group of ferrets following challenge: 0 = normal; 1 = mild lethargy; 2 = reduced activity; 3 = not playful or active, lethargic; 4 = severe illness, moribund (euthanized); 5 = found dead. No ferrets were found dead in this experiment, but all ferrets with score of 4 were euthanized and scored as 5 on the days following euthanization. (c) Average loss of body weight when compared to Day 0 post-challenge. Dead animals were assigned an arbitrary weight loss of 25%. (d) Average ferret body temperature when compared to the day before challenge. Dead animals were assigned an arbitrary temperature increase of 5%. (e) Virus titers in nasal flushes collected 1, 3, and 5 d post-challenge (animals with undetectable virus titers were given an arbitrary value of 10 (i.e., 1 log)). (f) Antigen-specific IgG titers for immunized ferrets measured 3 weeks after the boost immunization (immediately prior to challenge). For the survival data, all group pairs were compared using the Log-rank (Mantel-Cox) test and corrected for multiple comparisons by the Bonferroni method. For viral titer and IgG data, multiple comparisons between groups were analyzed by one-way ANOVA with Tukey's correction, ‡p<0.05 vs. PBS, #p < 0.05 vs. H5N1-S (3.75 μg), *p < 0.05 vs. H5N1-S (15 μg). The data in (e-f) are shown as box and whisker plots, with whiskers representing the minimum and maximum values.
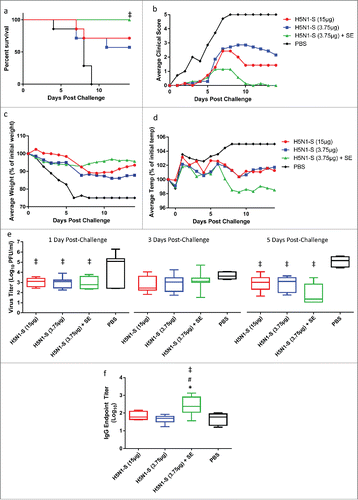
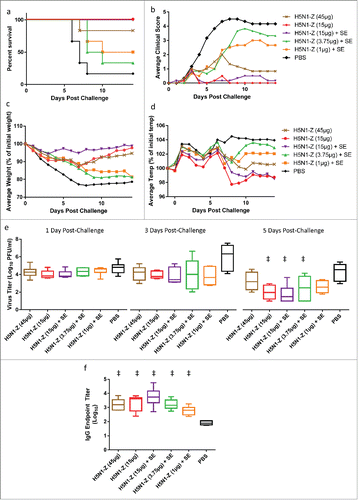
Figure 7. Ferrets immunized with adjuvanted H5N1 manufactured by CI (H5N1-Z) demonstrate similar clinical response compared to animals immunized without adjuvant. (a) Percent survival following challenge. (b) Average clinical score for each group of ferrets following challenge: 0 = normal; 1 = mild lethargy; 2 = reduced activity; 3 = not playful or active, lethargic; 4 = severe illness, moribund (euthanized); 5 = found dead. Ferrets with score of 4 were euthanized and scored as 5 on the days following euthanization. (c) Average loss of body weight when compared to Day 0 post-challenge. Dead animals were assigned an arbitrary weight loss of 25%. (d) Average ferret body temperature when compared to the day before challenge. Dead animals were assigned an arbitrary temperature increase of 5%. (e) Virus titers in nasal flushes collected 1, 3, and 5 d post-challenge (animals with undetectable virus titers were given an arbitrary value of 10 (i.e. 1 log)). (f) Antigen-specific IgG titers for immunized ferrets measured 3 weeks after the boost immunization (immediately prior to challenge). For the survival data, all group pairs were compared using the Log-rank (Mantel-Cox) test and corrected for multiple comparisons by the Bonferroni method. For viral titer and IgG data, multiple comparisons between groups were analyzed by one-way ANOVA with Tukey's correction, ‡p < 0.05 vs. PBS. The data in (e-f) are shown as box and whisker plots, with whiskers representing the minimum and maximum values.
