915
Views
3
CrossRef citations to date
0
Altmetric
Research Papers

Comparisons of the effect of naturally acquired maternal pertussis antibodies and antenatal vaccination induced maternal tetanus antibodies on infant's antibody secreting lymphocyte responses and circulating plasma antibody levels

, , , , , , & show all
Pages 886-893 | Received 12 Oct 2015, Accepted 23 Dec 2015, Published online: 13 May 2016

Figures & data

Table 1. Characteristics of infants.Footnote1

Figure 1. Tetanus vaccine-specific antibody responses of infants (geometric mean with 95% CI). (A) Plasma anti-TT IgG levels of infants at 6, 15 and 1 y of age, received three doses of DTwP-HepB-Hib combination vaccines at 1 mo interval beginning at 6 wk of age. (B) Antibody secreting lymphocyte (ALS) anti-TT IgG responses at 15 wk of age. (C) Plasma anti-TT IgG levels of infants at 15 wk of age and (D) Plasma anti-TT IgG levels of infants at 1 y of age by pre-vaccination (6 wk) antibody levels. Centiles are based on data from this study population. Specific anti-TT IgG (IU/mL) ranges for centile group at 6 wk were: <25th centile 0.08 – 0.51; 25–75th centile 0.58 – 1.41; >75th centile 1.82–12.2. Dotted horizontal line represents protective plasma anti-TT-IgG level. **p < 0.01, *p < 0.05, #p < 0.10.
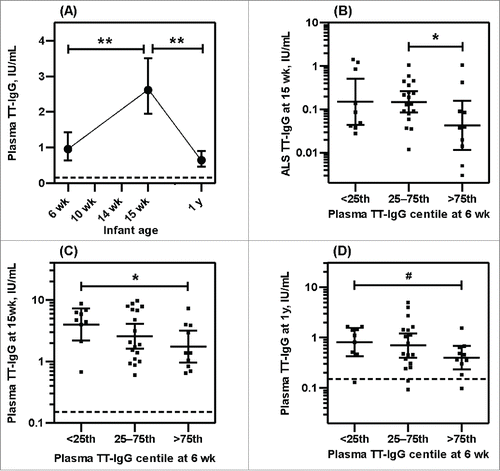
Figure 1. Tetanus vaccine-specific antibody responses of infants (geometric mean with 95% CI). (A) Plasma anti-TT IgG levels of infants at 6, 15 and 1 y of age, received three doses of DTwP-HepB-Hib combination vaccines at 1 mo interval beginning at 6 wk of age. (B) Antibody secreting lymphocyte (ALS) anti-TT IgG responses at 15 wk of age. (C) Plasma anti-TT IgG levels of infants at 15 wk of age and (D) Plasma anti-TT IgG levels of infants at 1 y of age by pre-vaccination (6 wk) antibody levels. Centiles are based on data from this study population. Specific anti-TT IgG (IU/mL) ranges for centile group at 6 wk were: <25th centile 0.08 – 0.51; 25–75th centile 0.58 – 1.41; >75th centile 1.82–12.2. Dotted horizontal line represents protective plasma anti-TT-IgG level. **p < 0.01, *p < 0.05, #p < 0.10.

Figure 2. Positive association between vaccine specific ALS and plasma antibody responses Correlation between vaccine specific ALS anti-IgG at 15 wk of age and vaccine specific plasma anti-IgG at 15 wk and at 1 y of age for tetanus (A-B) and pertussis (C-D) vaccines. Spearman correlation coefficients (rs) and p-values are indicated.
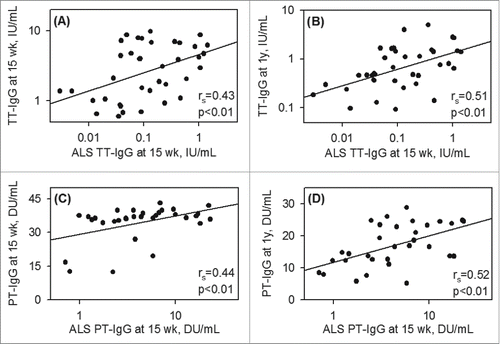
Figure 2. Positive association between vaccine specific ALS and plasma antibody responses Correlation between vaccine specific ALS anti-IgG at 15 wk of age and vaccine specific plasma anti-IgG at 15 wk and at 1 y of age for tetanus (A-B) and pertussis (C-D) vaccines. Spearman correlation coefficients (rs) and p-values are indicated.

Table 2. Multivariate linear regression analysis of Tetanus (TT) and Pertussis (PT) specific IgG responses in antibody secreting lymphocyte responses (ALS) at 15 wk and plasma antibody level at 1 y of age, received three doses of pentavalent vaccines (DPT/Hib/HBV) at 1 mointerval beginning at 6 wk of age.

Figure 3. Pertussis vaccine specific antibody responses of infants (geometric mean with 95% CI). (A) Plasma anti-PT IgG levels of infants at 6, 15 and 1 y of age, received three doses of DTwP-HepB-Hib combination vaccines at 1 mo interval beginning at 6 wk of age. (B) Antibody secreting lymphocyte (ALS) anti-PT IgG responses at 15 wk of age. (C) Plasma anti-PT IgG levels of infants at 15 wk of age and (D) Plasma anti-PT IgG levels of infants at 1 y of age by pre-vaccination (6 wk) antibody levels. Centiles are based on data from this study population. Specific anti-PT IgG (DU/mL) ranges for centile group at 6 wk were: <25th centile 0.82 – 4.60; 25–75th centile 5.41 – 9.87; >75th centile 10.1–21.6. Dotted horizontal line represents protective plasma anti-PT-IgG level. **p < 0.01, *p < 0.05, #p < 0.10.
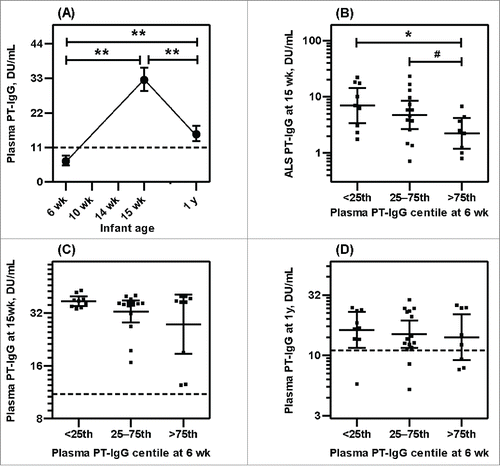
Figure 3. Pertussis vaccine specific antibody responses of infants (geometric mean with 95% CI). (A) Plasma anti-PT IgG levels of infants at 6, 15 and 1 y of age, received three doses of DTwP-HepB-Hib combination vaccines at 1 mo interval beginning at 6 wk of age. (B) Antibody secreting lymphocyte (ALS) anti-PT IgG responses at 15 wk of age. (C) Plasma anti-PT IgG levels of infants at 15 wk of age and (D) Plasma anti-PT IgG levels of infants at 1 y of age by pre-vaccination (6 wk) antibody levels. Centiles are based on data from this study population. Specific anti-PT IgG (DU/mL) ranges for centile group at 6 wk were: <25th centile 0.82 – 4.60; 25–75th centile 5.41 – 9.87; >75th centile 10.1–21.6. Dotted horizontal line represents protective plasma anti-PT-IgG level. **p < 0.01, *p < 0.05, #p < 0.10.

Reprints and Corporate Permissions

Please note: Selecting permissions does not provide access to the full text of the article, please see our help page How do I view content?

To request a reprint or corporate permissions for this article, please click on the relevant link below:

Academic Permissions

Please note: Selecting permissions does not provide access to the full text of the article, please see our help page How do I view content?

Obtain permissions instantly via Rightslink by clicking on the button below:

If you are unable to obtain permissions via Rightslink, please complete and submit this Permissions form. For more information, please visit our Permissions help page.