Figures & data
Figure 1. The change of the fluorescence intensity (A) and peak wavelength (B) as a function of NR concentration. Control sample contained NR in PBS. Samples with virus contained the same amount of NR as the control samples. (C) The change of peak wavelength in the absence and presence of virus with TX-100 concentration. (D) Error bars represent standard deviation (n = 3).
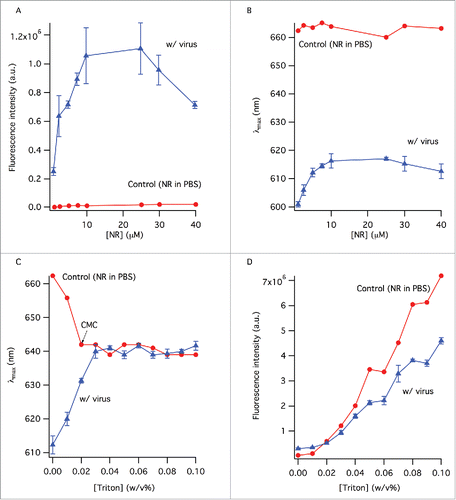
Figure 2. Viral splitting kinetics probed by NR fluorescence. (A) Change of the emission peak intensity with time at varying TX-100 concentrations (w/v). The lines show fits to single exponential function as outlined in the method section. (B) Time component, , obtained from the curve fits in (A). The line is a curve fit by a sigmoidal function excluding the data point at 0% TX-100 as outlined in the method section. The error bars represent standard deviation generated by the curve fits from (A).
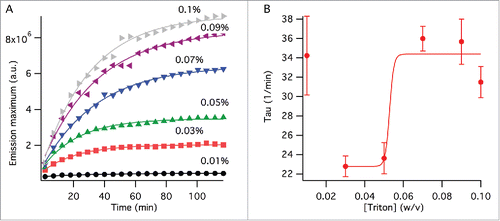
Figure 3. Multi–peak fitting using the exponentially–modified–Gaussian fitting function, showing dye molecules populated in 3 distinct environments, across different TX-100 concentrations (w/v): (A) 0%, (B) 0.01%, (C) 0.02%, (D) 0.04%, (E) 0.09%, and (F) 0.1%. An emission wavelength range of 550–750 nm was selected for peak fitting to exclude noise from the 2 tails. The 3 fitted peaks, representing 3 distinct dye environments, make up each spectrum. The solid lines represent the sum of the peaks 1–3. Change of the area under, and, the maximum emission wavelength of each fitted peak was determined for the different surfactant concentrations to quantify splitting extent.
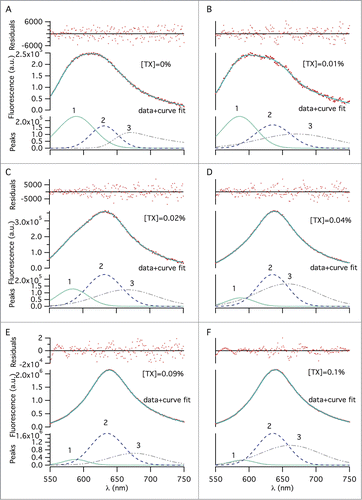
Figure 4. (A) Change of the peak wavelengths from multi-peak fitting with TX-100 concentration. (B) Change of the % areas of the peaks from (A) with TX-100 concentration. (C) Split ratio by emission, calculated as a sum of peak 2 and 3's % areas. (D) Change of the 3 fluorescence lifetimes as a function of TX-100 concentration. (E) Change of the weighted % contributions of the lifetimes from (D) to the total lifetime decay, as a function of TX-100 concentration. (F) Split ratio by lifetime, calculated as a sum of tau 1 and tau 2's % contributions. The error bars represent standard deviation (n = 3).
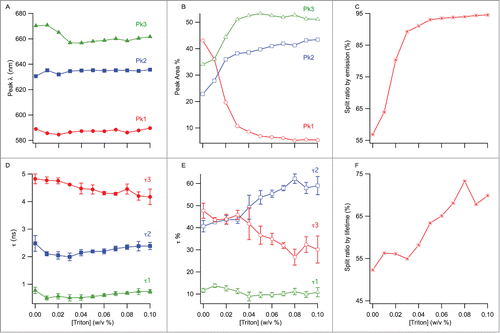
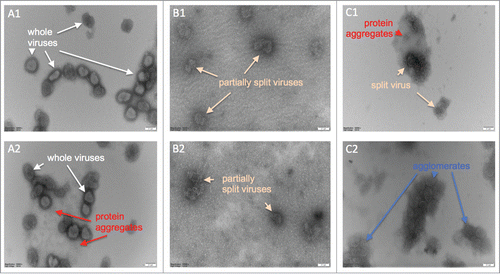
Figure 5. Electron micrographs of negatively stained inactivated influenza viruses; numbers 1 and 2 indicate repeats of the same samples. (A1 & A2) Whole viruses prior to the TX-100 treatment, (B1 & B2) after treatment with 0.04% TX-100 for 40 minutes, and, (C1 & C2) after treatment with 0.07% TX-100 for 40 minutes. Virus dimensions ranged from ˜100–250 nm. Scale bar is 100 nm.