1,081
Views
10
CrossRef citations to date
0
Altmetric
Research Papers

Evaluation of potential immunogenicity differences between Pandemrix™ and Arepanrix

, , &
Pages 2289-2298 | Received 09 Dec 2015, Accepted 16 Mar 2016, Published online: 25 Aug 2016

Figures & data

Figure 1. Avidity parameters per vaccine group. The end association rate (binding response at the end of the association phase; A), dissociation rate (fraction of complex that remained bound at the end of the dissociation phase; B), dissociation rate constant kd (C), and correlation between the dissociation rate and the kd (D) were assessed for serum samples obtained 3 weeks after vaccination from children who received either the D-Pan or Q-Pan vaccine. Bars and error bars represent the means of 2 analysis runs per sample and the standard deviation (s.d.), respectively. HA-specific signals were corrected for background binding on the reference channel and for the signal of the blank. Control, an A(H1N1)pdm09 HA-specific mouse monoclonal antibody. RU, resonance units.
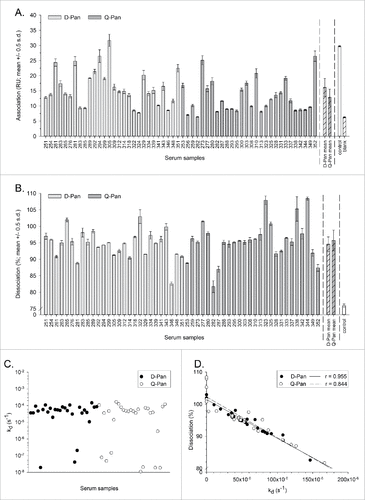
Figure 1. Avidity parameters per vaccine group. The end association rate (binding response at the end of the association phase; A), dissociation rate (fraction of complex that remained bound at the end of the dissociation phase; B), dissociation rate constant kd (C), and correlation between the dissociation rate and the kd (D) were assessed for serum samples obtained 3 weeks after vaccination from children who received either the D-Pan or Q-Pan vaccine. Bars and error bars represent the means of 2 analysis runs per sample and the standard deviation (s.d.), respectively. HA-specific signals were corrected for background binding on the reference channel and for the signal of the blank. Control, an A(H1N1)pdm09 HA-specific mouse monoclonal antibody. RU, resonance units.

Table 1. HI titers and avidity parameters.

Figure 2. Relationship between HI titers and avidity parameters before and after sample purification. Serum samples were obtained 3 weeks after vaccination from children who received either the D-Pan or Q-Pan vaccine. Samples were purified to reduce the fractions of IgM and non-specific protein. End association and dissociation rates were assessed on the serum samples before purification, as well as on the purified IgG fraction (left-hand and right-hand panels, respectively). Symbols represent the averages of 2 analysis runs per sample. The r correlation (indicated in the left-hand corner of each graph) was determined irrespective of the vaccine group. RU, resonance units. HI titer, hemagglutination inhibition titer.
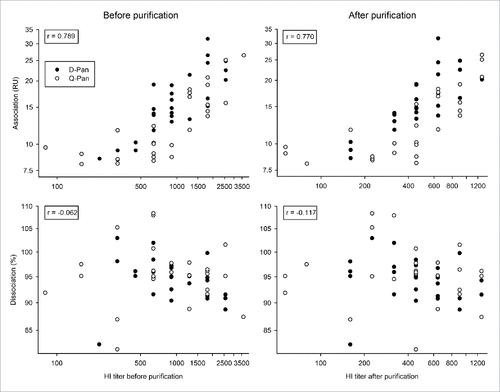
Figure 2. Relationship between HI titers and avidity parameters before and after sample purification. Serum samples were obtained 3 weeks after vaccination from children who received either the D-Pan or Q-Pan vaccine. Samples were purified to reduce the fractions of IgM and non-specific protein. End association and dissociation rates were assessed on the serum samples before purification, as well as on the purified IgG fraction (left-hand and right-hand panels, respectively). Symbols represent the averages of 2 analysis runs per sample. The r correlation (indicated in the left-hand corner of each graph) was determined irrespective of the vaccine group. RU, resonance units. HI titer, hemagglutination inhibition titer.

Figure 4. Relationship between end association rates and HI titers after adjustment for the antibody concentration. The correlation between the log10-transformed data of the end association rate and hemagglutination inhibition (HI) titers was assessed after adjustment for the antibody concentration. Serum samples were obtained 3 weeks after vaccination from children who received either the D-Pan or Q-Pan vaccine. Symbols represent the averages of 2 analysis runs per sample. Regression lines were estimated by analysis of covariance modeling. RU, resonance units.
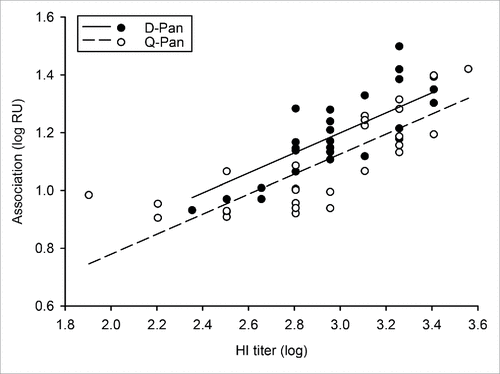
Figure 4. Relationship between end association rates and HI titers after adjustment for the antibody concentration. The correlation between the log10-transformed data of the end association rate and hemagglutination inhibition (HI) titers was assessed after adjustment for the antibody concentration. Serum samples were obtained 3 weeks after vaccination from children who received either the D-Pan or Q-Pan vaccine. Symbols represent the averages of 2 analysis runs per sample. Regression lines were estimated by analysis of covariance modeling. RU, resonance units.

Table 2. Geometric mean (ratio) of the association rate after adjustment for the antibody concentration.

Figure 3. Distribution of avidity parameters. Distributions of the log10-transformed data for the end association rate (A), dissociation rate (B) and the dissociation rate constant kd(C) were determined using serum samples obtained 3 weeks after vaccination from children who received either the D-Pan or Q-Pan vaccine. Box-and-whiskers plots represent the medians and interquartile ranges (boxes), and the minimum and maximum values (whiskers). Diamonds and open circles represent means and outliers, respectively. Values above the 75th percentile + 1.5 IQR, or below the 25th percentile – 1.5 IQR, were considered outliers. RU, resonance units.
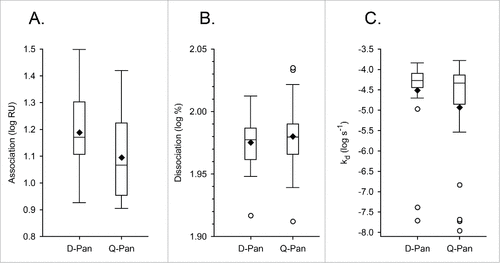
Figure 3. Distribution of avidity parameters. Distributions of the log10-transformed data for the end association rate (A), dissociation rate (B) and the dissociation rate constant kd(C) were determined using serum samples obtained 3 weeks after vaccination from children who received either the D-Pan or Q-Pan vaccine. Box-and-whiskers plots represent the medians and interquartile ranges (boxes), and the minimum and maximum values (whiskers). Diamonds and open circles represent means and outliers, respectively. Values above the 75th percentile + 1.5 IQR, or below the 25th percentile – 1.5 IQR, were considered outliers. RU, resonance units.
Supplemental material

Supplementary Figures and Tables

Download Zip (167.1 KB)