1,373
Views
12
CrossRef citations to date
0
Altmetric
Research Papers

Immunogenicity and protective efficacy of rotavirus VP8* fused to cholera toxin B subunit in a mouse model

, , , , , , & show all
Pages 2959-2968 | Received 16 Mar 2016, Accepted 17 Jun 2016, Published online: 29 Jul 2016

Figures & data

Figure 1. Expression, purification and characterization of the recombinant proteins. (A) Schematic diagram of the recombinant proteins. (B) 12% SDS-PAGE and immunoblotting analysis of the purified recombinant proteins. The antibody in immunoblotting was anti-VP8 mAb 1E1. Lane M: protein molecular weight markers; lane 1, CTB; lane 2, VP8-1; lane 3, CTB-VP8-1; lane 4, VP8-1-CTB. (C) HPSEC (G3000PWXL) analysis of purified proteins. The retention time (the deduced molecular weight) for a given protein was labeled with the corresponding color of its curve: green for CTB-VP8-1, red for VP8-1-CTB, blue for VP8-1 and purple for CTB. (D) The AUC analysis of VP8-1 and the fusion proteins. (E) The binding activity of the recombinant proteins to GM1 detected using anti-VP8 mAb 1E1. (F) The binding activity of the recombinant proteins to GM1 detected using anti-serum against CTB. In both (E) and (F), each assay was repeated in 3 wells, and the error bar represents the SD.
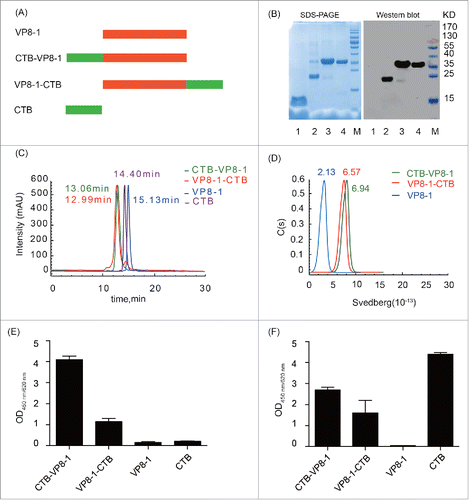
Figure 1. Expression, purification and characterization of the recombinant proteins. (A) Schematic diagram of the recombinant proteins. (B) 12% SDS-PAGE and immunoblotting analysis of the purified recombinant proteins. The antibody in immunoblotting was anti-VP8 mAb 1E1. Lane M: protein molecular weight markers; lane 1, CTB; lane 2, VP8-1; lane 3, CTB-VP8-1; lane 4, VP8-1-CTB. (C) HPSEC (G3000PWXL) analysis of purified proteins. The retention time (the deduced molecular weight) for a given protein was labeled with the corresponding color of its curve: green for CTB-VP8-1, red for VP8-1-CTB, blue for VP8-1 and purple for CTB. (D) The AUC analysis of VP8-1 and the fusion proteins. (E) The binding activity of the recombinant proteins to GM1 detected using anti-VP8 mAb 1E1. (F) The binding activity of the recombinant proteins to GM1 detected using anti-serum against CTB. In both (E) and (F), each assay was repeated in 3 wells, and the error bar represents the SD.

Figure 2. The reactivity of the recombinant proteins with conformation-sensitive VP8-specific neutralizing mAbs and mouse anti-serum elicited by inactivated rotavirus. (A) mAb B1 (IC50 = 100 ng/ml); (B) mAb B3 (IC50 = 80 ng/ml); (C) mAb B5 (IC50 = 55 ng/ml); (D) Pooled serum samples from inactivated rotavirus immunized mice. Each assay was repeated in 3 wells, and the error bar represents the SD.
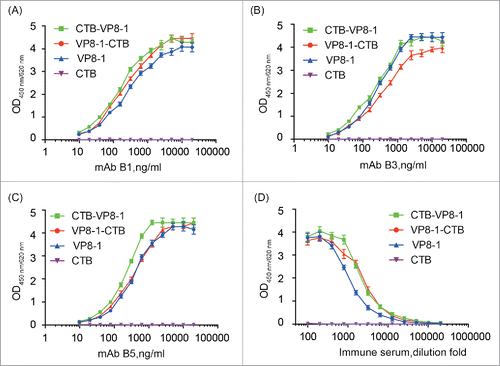
Figure 2. The reactivity of the recombinant proteins with conformation-sensitive VP8-specific neutralizing mAbs and mouse anti-serum elicited by inactivated rotavirus. (A) mAb B1 (IC50 = 100 ng/ml); (B) mAb B3 (IC50 = 80 ng/ml); (C) mAb B5 (IC50 = 55 ng/ml); (D) Pooled serum samples from inactivated rotavirus immunized mice. Each assay was repeated in 3 wells, and the error bar represents the SD.

Figure 3. The immunogenicity of the recombinant proteins. Groups of mice were immunized 3 times at an interval of 14 d with 10 μg of CTB-VP8-1, VP8-1-CTB, VP8-1 or CTB in aluminum hydroxide adjuvant, and the serum samples collected on day 14 after the final immunization were tested. (A) Anti-VP8 antibody titers, which are presented on a log10 scale; (B) neutralizing antibody titers, which are presented on a log2 scale. The error bars indicate the standard error of each group (n = 7). Different numbers of stars (*) indicate significant difference between the anti-VP8 antibody titers or neutralizing antibody titers elicited by the fusion proteins and those elicited by VP8-1 (****, P < 0.0001, **, P < 0.01).

Figure 3. The immunogenicity of the recombinant proteins. Groups of mice were immunized 3 times at an interval of 14 d with 10 μg of CTB-VP8-1, VP8-1-CTB, VP8-1 or CTB in aluminum hydroxide adjuvant, and the serum samples collected on day 14 after the final immunization were tested. (A) Anti-VP8 antibody titers, which are presented on a log10 scale; (B) neutralizing antibody titers, which are presented on a log2 scale. The error bars indicate the standard error of each group (n = 7). Different numbers of stars (*) indicate significant difference between the anti-VP8 antibody titers or neutralizing antibody titers elicited by the fusion proteins and those elicited by VP8-1 (****, P < 0.0001, **, P < 0.01).

Figure 4. The course of diarrhea in pups after rotavirus challenge in a mouse maternal antibody protection model. The pups in the 4 immunized groups (immunized with CTB-VP8-1, VP8-1-CTB, VP8-1, CTB and PBS) were challenged with rotavirus strain LLR on days 7 of life, and they were monitored daily for diarrhea for 7days post infection. (A) The percentage of pups with diarrhea from 1 to 7 d post infection. (B) The percentage of pups with severe diarrhea from 1 to 7 d post infection. Different numbers of * indicate significant differences between the percentage of pups with diarrhea or severe diarrhea in a given immunized group and those in the CTB group (**, P < 0.01, ***, P < 0.001 and ****, P < 0.0001).
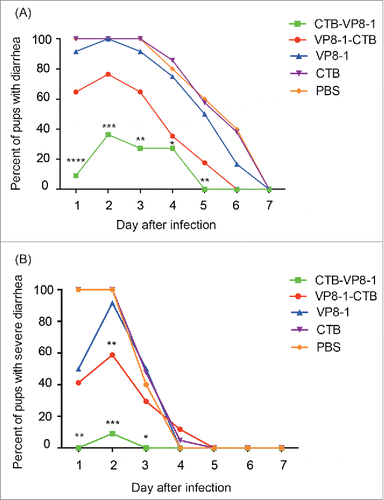
Figure 4. The course of diarrhea in pups after rotavirus challenge in a mouse maternal antibody protection model. The pups in the 4 immunized groups (immunized with CTB-VP8-1, VP8-1-CTB, VP8-1, CTB and PBS) were challenged with rotavirus strain LLR on days 7 of life, and they were monitored daily for diarrhea for 7days post infection. (A) The percentage of pups with diarrhea from 1 to 7 d post infection. (B) The percentage of pups with severe diarrhea from 1 to 7 d post infection. Different numbers of * indicate significant differences between the percentage of pups with diarrhea or severe diarrhea in a given immunized group and those in the CTB group (**, P < 0.01, ***, P < 0.001 and ****, P < 0.0001).

Table 1. The onset, duration and severity of rotavirus induced diarrhea for pups in a given immunized group in a maternal antibody model.

Figure 5. H&E staining images of ileum tissues after rotavirus challenge in a mouse maternal antibody model. The ileums of the pups were collected on day 2 post infection, fixed and sliced. Then, the sections were stained with hematoxylin and eosin (H&E) and observed under a microscope at an original magnification of 20×. Arrows indicate different histological changes such as vacuolar degeneration and necrosis of enterocytes (→), villus shortening (→), shedding of villus tips (→) and inflammatory cells in the villus stroma (→).

Figure 5. H&E staining images of ileum tissues after rotavirus challenge in a mouse maternal antibody model. The ileums of the pups were collected on day 2 post infection, fixed and sliced. Then, the sections were stained with hematoxylin and eosin (H&E) and observed under a microscope at an original magnification of 20×. Arrows indicate different histological changes such as vacuolar degeneration and necrosis of enterocytes (→), villus shortening (→), shedding of villus tips (→) and inflammatory cells in the villus stroma (→).

Reprints and Corporate Permissions

Please note: Selecting permissions does not provide access to the full text of the article, please see our help page How do I view content?

To request a reprint or corporate permissions for this article, please click on the relevant link below:

Academic Permissions

Please note: Selecting permissions does not provide access to the full text of the article, please see our help page How do I view content?

Obtain permissions instantly via Rightslink by clicking on the button below:

If you are unable to obtain permissions via Rightslink, please complete and submit this Permissions form. For more information, please visit our Permissions help page.