
Figures & data
Figure 1. Participant flow chart. Note: AS03, tocopherol, oil-in-water emulsion-based Adjuvant System; CI, confidence intervals; TIV, inactivated trivalent influenza vaccine; Year 1, 2008/09; Year 2, 2009/10.
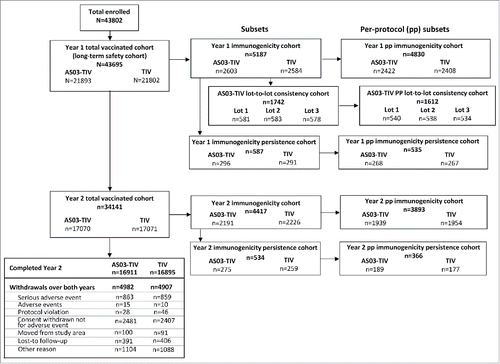
Table 1. Hemagglutination-inhibition-based adjusted GMT ratios at Day 21 after vaccination for 3 lots of AS03-TIV in the per-protocol consistency cohort.
Figure 2. Day 21 hemagglutination-inhibition-based GMTs in the per-protocol immunogenicity cohort in Year 1 (A) and Year 2 (B). Note: AS03, tocopherol, oil-in-water emulsion-based Adjuvant System; CI, confidence intervals; TIV, inactivated trivalent influenza vaccine; GMT, geometric mean titer; N, number of subjects in the cohort with data available at time-point; Year 1, 2008/09; Year 2, 2009/10; Influenza A strains were A/Brisbane/59/2007 (H1N1 strain) and A/Uruguay/716/2007 (H3N2 strain); Influenza B strains were B/Brisbane/3/2007 (Victoria lineage) in Year 1 and B/Brisbane/60/2008 (Yamagata lineage) in Year 2.
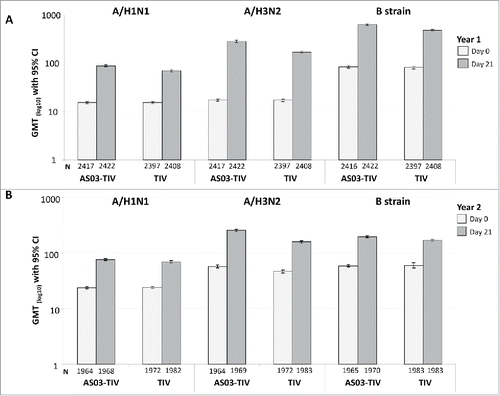
Table 2. Hemagglutination-inhibition-based immunogenicity in Year 1 and Year 2 in the per-protocol immunogenicity cohort.
Figure 3. Day 21 and 180 hemagglutination-inhibition-based GMTs in the per-protocol immunogenicity persistence cohorts in Year 1 (A) and Year 2 (B). Note: AS03, tocopherol, oil-in-water emulsion-based Adjuvant System; CI, confidence intervals; TIV, inactivated trivalent influenza vaccine; N, number of subjects in the cohort with data available at time-point; GMT, geometric mean titer; Year 1, 2008/09; Year 2, 2009/10; Influenza A strains were A/Brisbane/59/2007 (H1N1 strain) and A/Uruguay/716/2007 (H3N2 strain); Influenza B strains were B/Brisbane/3/2007 (Victoria lineage) in Year 1 and B/Brisbane/60/2008 (Yamagata lineage) in Year 2.
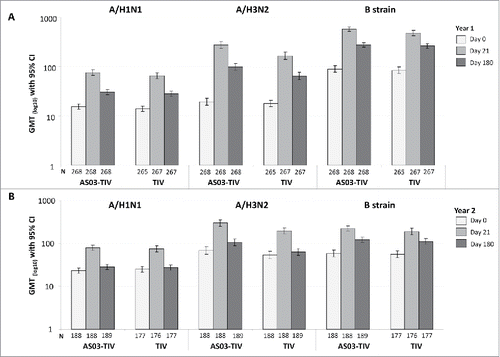
Figure 4. Day 21 and 180 hemagglutination-inhibition-based SCRs in the per-protocol immunogenicity persistence cohorts in Year 1 (A) and Year 2 (B). Note: AS03, tocopherol, oil-in-water emulsion-based Adjuvant System; CI, confidence intervals; TIV, inactivated trivalent influenza vaccine; N, number of subjects in the cohort with data available at time-point; Year 1, 2008/09; Year 2, 2009/10; Influenza A strains were A/Brisbane/59/2007 (H1N1 strain) and A/Uruguay/716/2007 (H3N2 strain); Influenza B strains were B/Brisbane/3/2007 (Victoria lineage) in Year 1 and B/Brisbane/60/2008 (Yamagata lineage) in Year 2; SCR, seroconversion rate defined as the proportion of seronegative subjects at baseline with post-vaccination titer of ≥1:40, or pre-vaccination titer of ≥1:10 and ≥4-fold increase post-vaccination.
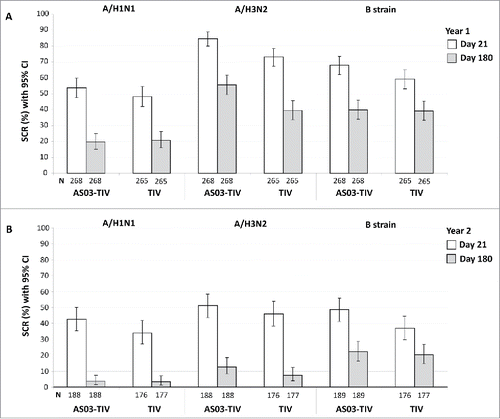
Table 3. Season strength, circulating influenza viruses, and attack rates by country.
Table 4. Descriptive statistics HI titers against A/H3N2 in the immunogenicity subset.
Figure 5. Number of subjects in each titer category and number of A/H3N2 cases (A) and proportion of subjects in each titer category with PCR-confirmed A/H3N2 infection (B) in the immunogenicity subset.
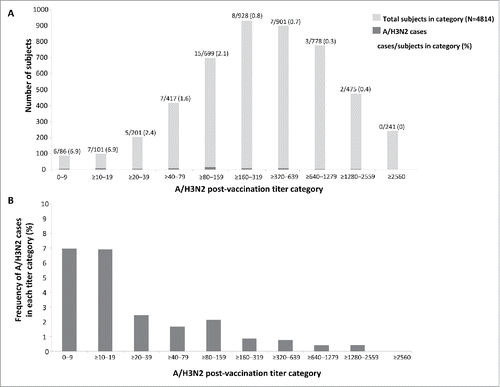
Figure 6. A/H3N2 HI antibody titer and estimated risk of A/H3N2 influenza infection overall (A), in a low/moderate season (B) and in a high season (C) in the immunogenicity subset. Note: Points represent the observed proportions of cases and the dotted curve show 95% confidence interval; HI, hemagglutination-inhibition.
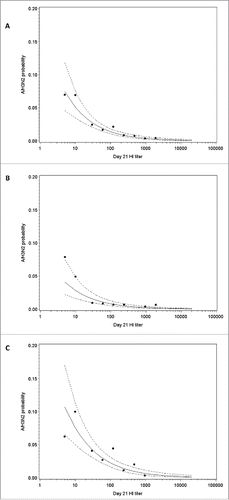
Table 5. Parameter estimates of the logistic regression model obtained after variable selection.