
Figures & data
Table 1. Demographic findings of study subjects
Figure 1. Flow chart of study. Subjects with serological infections were analyzed separately to evaluate the pure vaccine effect.
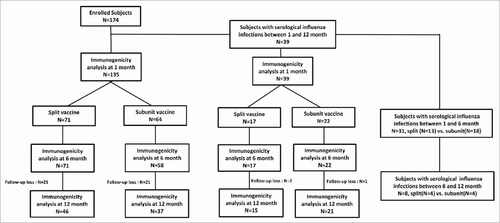
Table 2. Immunogenicityof split and subunit influenza vaccines in all subjects
Table 3. Immunogenicity of split and subunit influenza vaccines in all subjects who completed 12-month follow-up
Table 4. Immunogenicity against influenza strains in the subjects with serological infections
Table 5. Immunogenicity of influenza vaccines in subjects who completed 12-month follow-up excluding the subjects with serological infections
Table 6. Immunogenicity of influenza vaccines by age groups excluding the subjects with serological infections