
Figures & data
Figure 1. Local reactions. (A) Displays the duration of solicited local reactions following vaccination, on average across all 3 doses of each study vaccine as a percentage of vaccinated participants. Events displayed represent any severity of symptom. (B) Presents the average day after vaccination whereby the maximum local reaction was first experienced for each vaccine over all 3 doses, as a percentage of vaccinees. Day 0 is the day of vaccination.
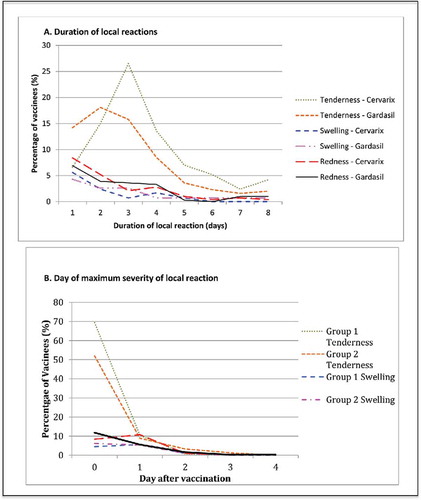
Figure 2. Systemic reactions. (A) Displays the duration of solicited systemic reactions following vaccinations on average across all 3 doses of each study vaccine, as a percentage of vaccinated participants. Events displayed represent any severity of sympton. (B) Presents the average day after vaccination whereby the maximum systemic reaction was first experienced for each vaccine over all 3 doses, as a percentage of vaccines. Day 0 is the day of vaccination.
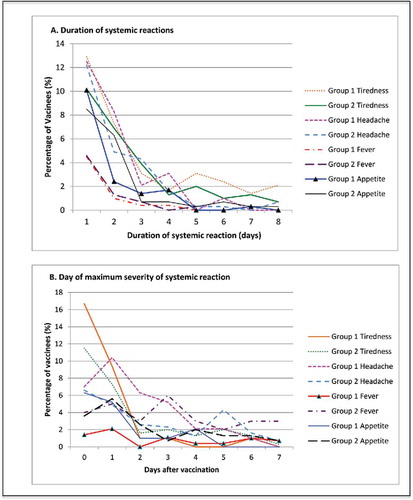
Table 1. Details the characteristics of the vaccines used in this study.
Table 2. Depicts the number of vaccinees experiencing any level of local or systemic symptoms after any dose for both vaccines. The percentage represents the proportion of participants who experienced at least one event over the 3 doses of HPV vaccine.
Table 3. Depicts the percentage of participants who experienced at least one event of moderate-severe or severe local and systemic symptoms across all 3 doses and any events recorded per dose. The data are presented by vaccine and a p value denotes whether a difference was observed at each dose and across the full vaccine schedule (significant p values in bold). Safety data was not complete for all doses, hence variations in denominator value across the table. Loss of appetite was missing 1–2 meals to having no appetite at all, fatigue as sleeping more than usual or most of the time and pain as discomfort to pain resulting in participants unwilling to use their arm. Temperature was considered mild if >37.5°C, moderate if >38.5°C and severe if ≥ 39°C. Redness and swelling were considered mild if >0 mm, moderate if >30 mm and severe if >50 mm in diameter. Headache was scored as mild, moderate or severe.