
Figures & data
Table 1. Demographic characteristics of study participants with CF and healthy siblings.
Figure 1. Results of the sensitivity analyses estimating the effect of measurement error in the diagnostic assays used to ascertain exposure (D0-NIRV) and outcome (detection of influenza RNA). The point and line edges represent the mean, 2.5th and 97.5th percentiles of the posterior distribution, respectively.
Figure 2. Proportion of subjects with any influenza virus RNA detection (either type (A)and/or B), by study day, cystic fibrosis (CF) status and non-influenza respiratory virus (D0-NIRV) detection status on day 0 (nCF, D0-NIRV+ = 18, nCF, D0-NIRV- = 40, nnon-CF, D0-NIRV+ = 4, nnon-CF, D0-NIRV- = 13).
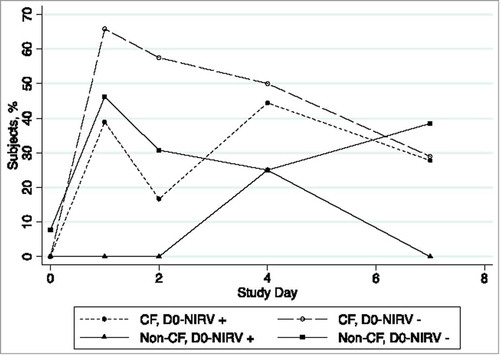
Table 2. Summary of influenza detection after vaccination with LAIV in study cohort (days 1–7 of follow-up).