Figures & data
Table 1. EpiMatrix analysis of amino acid sequences.
Figure 1. Peptides selected for inclusion in the class II DNA vaccine construct. Input sequence describes the antigen from which each peptide was derived and Cluster Address describes the location of each peptide within its source antigen. Under Cluster Sequence, the core peptide (underscored middle amino acids in bold) defines the actual cluster that was identified during the analysis. The stabilizing flanks (N-terminal and C-terminal, not bold) are included for use with the core sequence. Flanks are necessary stabilizing factors in any peptide synthesized for analysis in immunoassays. Hydrophobicity relates the grand average of hydropathy (GRAVY) score for each complete peptide. Peptides with hydrophobicity scores above +2 tend to be difficult to synthesize. HLA alleles considered in cluster analysis are the supertype representatives DRB1*0101, DRB1*0301, DRB1*0401, DRB1*0701, DRB1*0801, DRB1*1101, DRB1*1301, and DRB1*1501. The number of hits is the number of significant 9mer-to-allele assessments (EpiMatrix Z scores above 1.64, or the top 5% of random peptides, shaded medium blue) found within the sequence. The top 1% of random peptides is shaded dark blue, while top 10% assessments are shaded light blue. The EpiMatrix Cluster Score is derived from the number of hits normalized for the length of the cluster. Thus, Cluster Score is the excess or shortfall in predicted aggregate immunogenicity relative to a random peptide standard. Cluster Scores above +10 indicate significant potential for promiscuous response. Selected peptides each contain between 6 and 15 EpiMatrix hits and register Cluster Scores between 12.22 and 32.89.
Figure 2. In vitro HLA binding of peptides representing identified putative epitopes. The binding affinities of the peptides were calculated in competitive binding assays. The input protein, location of the epitope cluster in its source antigen, HLA DR allele tested, and calculated IC50 value in µM units are listed, respectively. Peptide binding affinity is shown according to the following: IC50 < 1 µM (Black), IC50 1 µM-10 µM (Dark Blue), IC50 10 µM-50 µM (Light Blue), IC50 50 µM-100 µM (Gray). Non-binders (White) are those peptides with IC50 values too high to accurately measure under binding conditions.
Table 2. Murine T cell epitopes contained within the class II multi-epitope construct.
Figure 3. IFN-γ ELISpot responses elicited in BALB/c mice vaccinated with the class II multi-epitope DNA vaccine. Splenocytes isolated on day 49 from individual mice vaccinated on days 0, 21, and 42 by IM EP with 20 (A), 35 (B), or 50 µg (C) of the class II multi-epitope DNA vaccine were stimulated for 48 h with a pool of peptides representing the identified class II VEEV epitopes, a pool of peptides representing the identified class II EBOV and SUDV epitopes, pools of overlapping peptides spanning the E1 or E2 envelope glycoprotein of VEEV, a pool of overlapping peptides spanning the GP of EBOV, or no peptide. Data are presented as the spot forming cells (SFC) per million splenocytes for individual mice with black horizontal bars representing the means for each group. Statistically significant responses (*, p ≤ 0.05) are indicated.
Figure 4. VEEV-specific antibody responses elicited by class II multi-epitope DNA construct in BALB/c mice. Serum samples obtained on days 0, 21, and 42 from mice (N = 4) vaccinated by IM EP with 20, 35, or 50 µg of the class II multi-epitope DNA vaccine were assayed for total IgG anti-VEEV antibodies by ELISA. The log10 mean titers for each dose group at each time point are represented by the black bars. Total IgG anti-VEEV responses were detected on day 42 from mice receiving 35 (*, p = 0.049) or 50 µg (*, p = 0.036) of the multi-epitope DNA vaccine as compared with day 0.
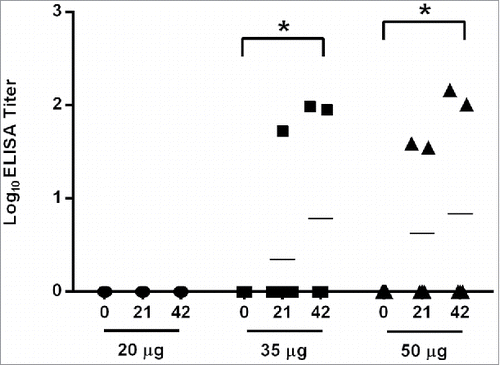
Figure 5. IFN-γ ELISpot responses elicited against the class II epitopes in vaccinated HLA-DR3 mice. Splenocytes isolated from groups of HLA-DR3 mice (N = 6) vaccinated with the multi-epitope construct followed by a peptide boost were stimulated for 48 h with individual peptides representing each epitope in the class II multi-epitope DNA vaccine, a pool of all the class II peptides, pools of overlapping peptides spanning the E1 or E2 envelope glycoprotein of VEEV, a pool of overlapping peptides spanning the GP of EBOV, or no peptide. Data are presented as the mean SFC per million splenocytes and are the average of 3 groups of 2 mice. Individual epitope and pooled epitope responses in vaccinated mice showing statistical significance when compared with the negative control group are indicated (*, p ≤ 0.05). A dotted line denotes the cutoff of 50 SFC over background per million splenocytes.
Figure 6. Virus-specific antibody responses elicited in vaccinated HLA-DR3 mice. Serum samples obtained on day 56 from groups of HLA-DR3 mice (N = 10) vaccinated as described in the Methods section were analyzed for anti-EBOV or -VEEV total IgG antibodies by ELISA or for VEEV-neutralizing antibodies by PRNT. Log10 ELISA titers for each mouse are indicated by symbols and group mean log10 titers are represented by black horizontal bars. (A) Significant total IgG anti-EBOV responses were detected in mice receiving the whole-antigen DNA vaccines (*, p < 0.0001) and the multi-epitope DNA vaccine (p = 0.0055) as compared with the negative control vaccine. (B) Significant total IgG anti-VEEV responses were detected in mice receiving the whole-antigen DNA vaccines (*, p < 0.0001) or the multi-epitope DNA vaccine (*, p < 0.0001) as compared with mice receiving the negative control vaccine. (C). Log10 PRNT80 titers for individual mice are indicated by symbols and group mean log10 PRNT80 titers are represented by black horizontal bars. Significant neutralizing antibody responses were generated in mice receiving the whole-antigen DNA vaccines (*, p = 0.0002) or multi-epitope DNA vaccine (*, p = 0.0033) as compared with mice receiving the negative control vaccine. The neutralizing antibody titers of mice that survived VEEV challenge are shown as open symbols.
Figure 7. Survival of vaccinated HLA-DR3 mice after EBOV or VEEV challenge. Groups of HLA-DR3 mice (N = 10) vaccinated as described in the Methods section were challenged 4 weeks after the final vaccination with 103 PFU of ma-EBOV by IP injection or with 104 PFU of VEEV by aerosol. Kaplan-Meier survival curves indicating the percentage of surviving mice at each day of the 28-day observation period are shown. (A) Significantly increased survival was observed for mice receiving the whole-antigen DNA vaccines (*, p < 0.01). No significant protection against EBOV challenge was observed for mice receiving the multi-epitope vaccine. (B) Significantly increased survival against VEEV challenge was observed for mice receiving the whole-antigen DNA vaccine (*, p = 0.0095) or the multi-epitope vaccine (*, p = 0.0031) as compared with those receiving the negative control vaccine.