Figures & data
Table 1. Characteristics of the participants at baseline (Per Protocol Set, PPS).
Table 2. HBeAg seroconversion after treatment (Per Protocol Set, PPS).
Figure 1. The percentages of T cell subtypes from the YIC, alum and saline groups after 0, 2, 4 and 6 injections. (A) Percentage changes of the HBsAg specific CD4+ T cells responded to corresponding treatments were represented by the 10 individual cytokine populations. Multifunctional Th1 cells are depicted in orange, Th2 in yellow and Treg in green. (B) Percentage changes of the HBsAg specific CD8+ T cells responded to corresponding treatments were represented by the 11 individual cytokine populations. Multifunctional Tc1 cells are depicted in blue, Tc17 in orange and Tcreg in gray. Data are presented as means from 10, 15 and 14 patients in the YIC, alum and saline groups, respectively. (C) Percent changes of the HBsAg specific CD8+ T cells of the YIC treated 2 patients with HBeAg seroconversions at weeks 24 and 48, and 2 patients in the saline control with HBeAg seroconversions at week 48.
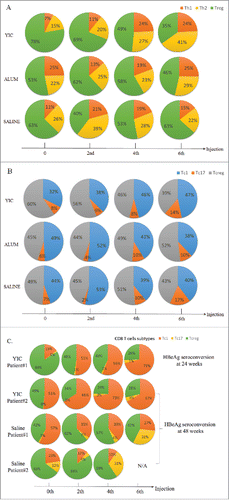
Figure 2. CD4+ T cell cytokine profiles from the YIC, alum and saline groups after 2, 4 and 6 injections. HBsAg specific cytokine production by PBMC fractionated CD4+ T cells after the injections. The mean frequency of each cytokine producing CD4+ T cells was analyzed by ICS from 10, 15 and 14 patients in the YIC, alum and saline groups, respectively. Cytokine producing CD4+ T cells of YIC as indicated in green, Alum in blue, Saline in black.
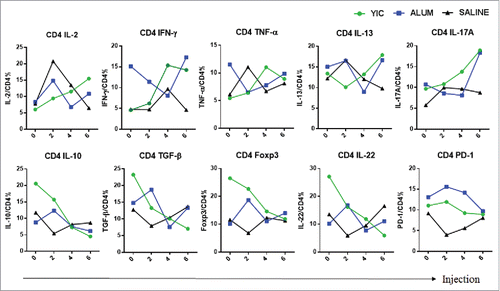
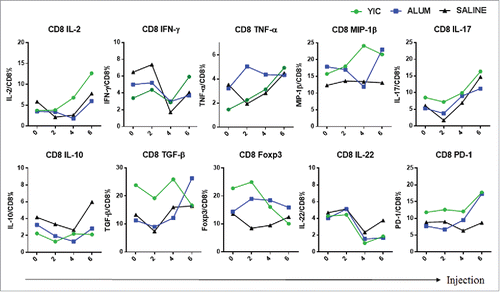
Figure 3. CD8+ T cell cytokine profiles from the YIC group, alum group and the saline group after 2, 4 and 6 injections. HBsAg specific cytokine production by PBMC fractionated CD8+ T cells after the injections. The mean frequency of each cytokine producing CD8+ T cells was analyzed by ICS from 10, 15 and 14 patients in the YIC, alum and saline groups, respectively. Cytokine producing CD8+ T cells of YIC as indicated in green, Alum in blue, Saline in black.