Figures & data
Table 1. Magnitude of the IFNγ response by different subjects to different antigens in the presence or absence of a TLR4-Agonist adjuvant (TLR4-A).
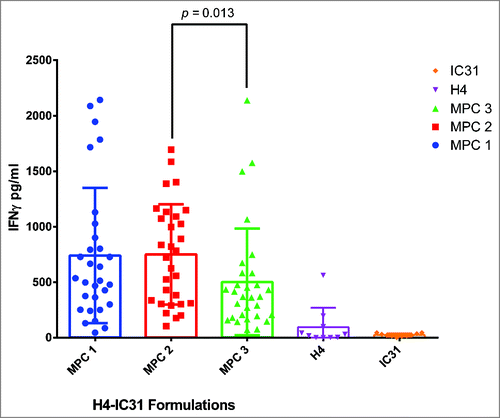
Figure 1. A comparison of 3 vaccine manufacture process conditions. The diluted fresh hWB from subject S05 was cultured with 3 different H4-IC31 formulations (MPC 1–3) using 30 wells/formulation in a standard 96 U-well microtiter plate. All supernatants were harvested after 10 d culture as previously reported.Citation10 The H4 (0.1 μg/ml) and IC31 (4.0 nmol KLK) alone controls used 10 wells each. The graph shows a scatter plot +/− SD of the IFNγ released by individual wells to highlight differences in the overall quality of the response to each formulation. The MPC 3 formulation yielded significantly lower levels of IFNγ than the MPC 2 formulation (p = 0.013) (Mann Whitney U test).