
Figures & data
Table 1. Sequence and localization of the Env CE.
Table 2. env DNA vaccine and T cell responses in vaccinated macaques.
Figure 1. CE are poorly immunogenic in env DNA vaccinated macaques. Analysis of Env CE T cell responses in 16 macaques immunized with a mixture of DNA expressing full-length Env including HIV-1 BaL. Env-specific IFN-γ T cell responses were measured using a matching peptide pool of HIV Env clade B strain BaL spanning gp120. CE-specific IFN-γ+ T responses were measured using a peptide pool (mixture of 15-mer overlapping by 11 AA and 10-mer overlapping by 9 AA) covering the 12 CE.
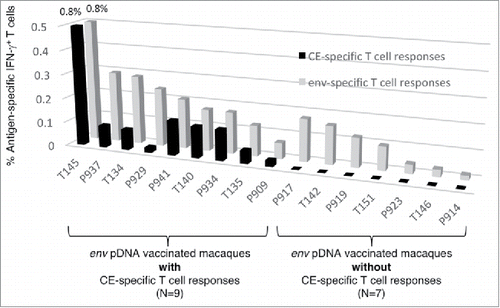
Table 3. Mapping of CE responses in selected macaques after vaccination with full-length HIV env DNA.
Figure 2. Env CE1 and Env CE2 expression vectors. (A) Env-CE1 and Env CE2 proteins span 220 amino acids distributed among 12 different CE. They are highly related, differing by 24 amino acids symbolized by asterisks, indicating number and location of the toggle AA. The Env CE1 and Env CE2 complete sequences are each 282 amino acids in length, including linkers (3 amino acids in length each) and a 29-amino acid BaL Env signal peptide. The linker sequence includes AAV, AAE, GAK, AAD, AAK, GAV, VAV, or AAF. The Env CE1 and Env CE2 sequences were inserted in the CMVkan expression vector between the CMV promoter and the bovine growth hormone polyadenylation signal. (B) HEK293T cells were transfected with HIV pDNAs expressing Env CE1 (lane 1), Env CE2 (lane 2), Env gp145dID (lane 3–5). Lane 6 contains a sample from mock-transfected cells. Proteins from the cell-associated (top panel: 1/100 of the sample) and extra-cellular (bottom panel: 1/200 of the sample) were analyzed. Western immunoblots were probed using the rabbit anti-gp120 sera. Equal loading of the blot with the cell-associated fraction was controlled by probing the membrane with an anti-actin antibody (middle panel). (C) Cell lysates from HEK293 cells transfected with plasmids expressing the HIV CE1, HIV CE2 and BaL gp145dID were treated with Endo H, PNGase F or left untreated. The samples were analyzed by Western immunoblot assay using a rabbit anti-HIV gp120 antibody. (D) Subcellular localization of HIV Env CE proteins is shown in HeLa-derived HLtat cells transfected with Env CE-FLAG plasmids. The HIV Env CE-FLAG proteins were visualized with anti-FLAG primary antibody followed by Alexa-Fluor 488 conjugated secondary antibody, and the nuclei were stained with DAPI (separate and merged images are shown).
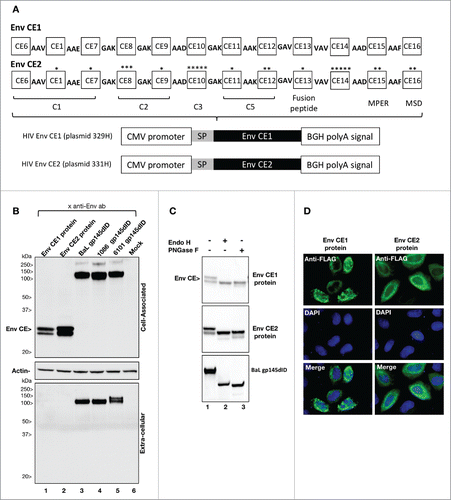
Figure 3. Env CE DNA vaccine induces T cell responses in macaques. (A) Cartoon shows the vaccination regimen used to prime of macaques. The animals were vaccinated 3x with a mixture of Env CE1 and Env CE2 DNA by intramuscular injection followed by in vivo electroporation. T cell responses were analyzed after the 2nd and 3rd vaccination and 3 months later. (B) CE-specific T cell responses (both CD4 and CD8) measured 2 weeks after the second and third vaccination, as well as 3 months later, in PBMC samples stimulated with a peptide pool covering all 12 CE. The percent of CE-specific IFN-γ+ T cells upon peptide stimulation is shown. (C) The % CE-specific IFN-γ+ producing CD4 and CD8 central memory (CM; CD28+CD95+) and effector memory (EM; CD28−CD95+) T cells was determined following peptide stimulation with the CE peptide pool. (D) CE-specific responses are cytotoxic. The percentage of IFN-γ+ producing CE-specific CD4 and CD8 T cells harboring Granzyme B and expressing CD107a was determined following stimulation by the CE peptide pool.
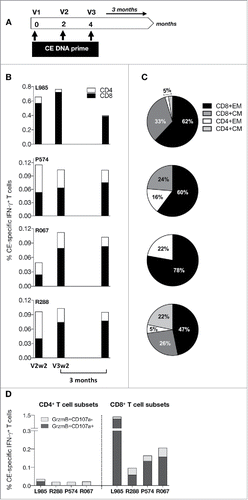
Figure 4. Env CE prime-boost vaccination. (A) Cartoon shows the vaccine regimen used in the prime-boost vaccination of the macaques. The boost was performed with a mixture of env DNA composed of clade B (BaL and 6101) and clade C (1086) env DNA covering the 23 CE sequences (including toggle AA) present in HIV Env CE1 and CE2 proteins. DNA was delivered by intramuscular injection followed by in vivo electroporation. (B) CE-specific T cell responses (both CD4 and CD8) measured at the time of the booster vaccination (V4, V5) and 2 weeks later. The longevity of the memory responses was monitored 8 months later. (C) The proportion of the memory responses was determined after the last booster vaccination. The % CE-specific IFN-γ+ producing CD4 and CD8 central memory (CM; CD28+CD95+) and effector memory (EM; CD28−CD95+) T cells was determined following stimulation with the peptide pool containing the 12 CE.
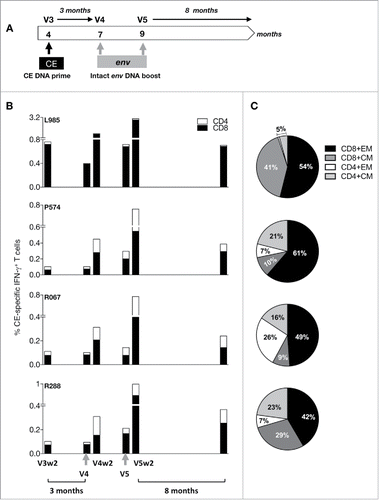
Table 4. Alignment of the Env CE and the HIV Env Sequences used in the booster vaccination.
Table 5. Mapping of CE responses after Env CE DNA prime and after env DNA boost.
Figure 5. CE prime-env DNA boost elicits potent and durable cytotoxic T cell responses. (A) Dot plots shows the Granzyme B content and degranulation activity (CD107a+) from unstimulated and peptide stimulated T lymphocytes from one vaccinated animals (P574) measured at 2 weeks after the 5th vaccination. The CD4+ (left panel) and CD8+ (right panel) CE-specific IFN-γ+ T cells are shown in black. (B) Frequency of CE-specific cytotoxic CD4+ T cell responses, and (C) CD8+ T cell responses after each booster vaccination are shown at 2 weeks after the priming (V3w2), after the 3 mo of rest at the day of the 1st booster vaccination (V4), 2 weeks later (V4w2), after a 2 mo rest period at the day of the 1st booster vaccination (V5), 2 weeks later (V5w2) and 8 months later.
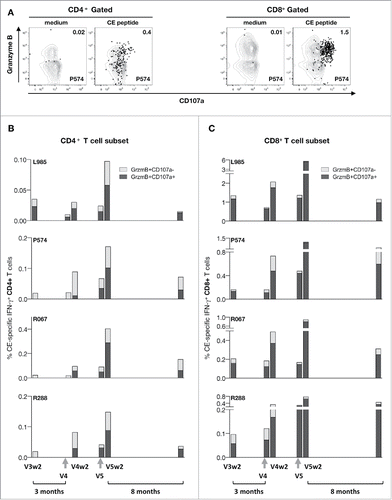
Figure 6. Mapping of the CE responses after prime and boost. The % CE-specific IFN-γ+ T cells after prime (V3w2) and after boost (V5w2) are plotted. The 12 individual peptide pools were used to determine the positive CE in the animals.
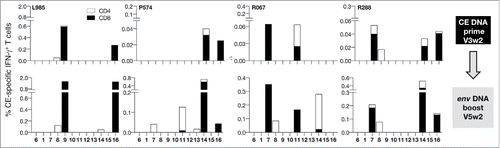
Figure 7. Humoral immune responses upon prime/boost. (A) Western immunoblot analysis was used to probe the Env CE proteins using plasma from vaccinated macaques. Proteins from cells transfected with a combination of HIV Env CE1 and Env CE2 plasmids were separated on denaturing gels and transferred onto membranes. Individual strips of membranes were incubated with plasma (1:100 dilution) from the vaccinated macaques and visualized using standard western blot methodology. (B) The Env CE DNA vaccine prime induced antibodies that can recognize gp120 Env by ELISA (HIV-1 IIIB) in animal P574. The responses were boosted by each of the full-length env DNA vaccination (4th and 5th vaccination V4w2, V5w2). (C) Antibodies induced by the HIV Env CE DNA vaccinated macaques recognize intact HIV Env proteins from both clade B (BaL gp145dID) and clade C (1086 gp145dID). HIV Env gp145 protein from transfected cells was separated on denaturing gels and transferred onto membranes. The membranes were incubated with plasma (dilution 1:100) from macaque L985 and P574 primed with Env CE DNA (3rd vaccination, V3wk2) and boosted with intact env DNA (5th vaccination, V5wk2). Proteins from mock-transfected cells served as a negative control.
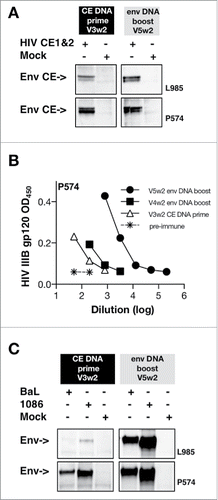
Table 6. Summary of CE immunity in the 4 env CE DNA vaccinated macaques.