
Figures & data
Table 1. Base-case analysis results (18-year time horizon).
Figure 1. PSA: Scatterplot for PHiD-CV vs. PCV-13 (18-year time horizon). PSA: Probabilistic sensitivity analysis; PCV-13: 13-valent pneumococcal conjugate vaccine; PHiD-CV: Pneumococcal non-typeable Haemophilus influenzae protein D conjugate vaccine; QALY: Quality-adjusted life year.
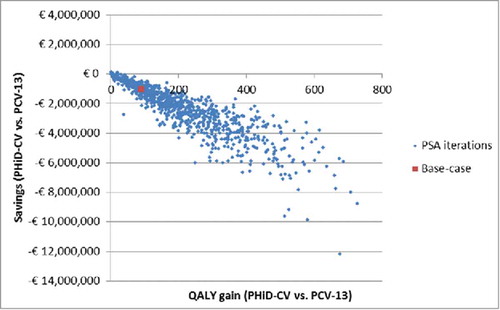
Figure 2. DSA: Tornado diagram of ICER of PHiD-CV vs. PCV-13.
AOM: Acute otitis media; DSA: Deterministic sensitivity analysis; ICER: Incremental cost-effectiveness ratio; IPD: Invasive pneumococcal disease; PHiD-CV: Pneumococcal non-typeable Haemophilus influenzae protein D conjugate vaccine; PCV-13: 13-valent pneumococcal conjugate vaccine; VE: Vaccine effectiveness.
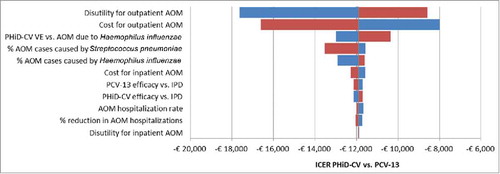
Figure 3. Model flow diagram. Rectangles represent mutually exclusive health states. Dotted rectangles represent absorbing health states and represent the proportion of the population removed from the model. Age-specific incidences are applied monthly to the susceptible population, after accounting for arm-specific VE. Costs and benefits are computed monthly and aggregated over the analyzed time horizon. Non-consulting AOM are accounted for in the quality-of-life impact calculation. No Vaccination: is a counterfactual scenario, in which universal vaccination is not fostered by the health system. It allows assessing the absolute value of PCV vaccination programs, and not only the comparison between 2 specific vaccination products.
AOM: Acute otitis media; PCV-7: 7-valent pneumococcal conjugate vaccine; PCV-13: 13-valent pneumococcal conjugate vaccine; PHiD-CV: Pneumococcal non-typeable Haemophilus influenzae protein D conjugate vaccine; Sp: Streptococcus pneumonia.
Table 2. Clinical inputs.
Table 3. Disutilities used in the model.
Table 4. Direct costs estimated in the model.