1,468
Views
8
CrossRef citations to date
0
Altmetric
Research Papers

Enrichment of Ly6Chi monocytes by multiple GM-CSF injections with HBV vaccine contributes to viral clearance in a HBV mouse model

, , , , , & ORCID Icon show all
Pages 2872-2882 | Received 28 Mar 2017, Accepted 16 Jun 2017, Published online: 18 Oct 2017

Figures & data

Figure 1. 3 × GM-CSF+VACCINE promotes the activation of CD11b+ CD11c+DC. (A) Schematic illustration of the full immunization workflow in AAV8–1.3HBV infected mice. (B, H) Three days after the second immunization, blood and inguinal lymph nodes were collected from the different immunization groups and analyzed. The percentages of CD11b+CD11c+ DC in blood (B) and inguinal lymph nodes (C) are shown. (D-F) Comparison of markers on CD11b+CD11c+ DC in blood: CD80 (D), MHC-I (E), and MHC-II (F). (G-H) Serum concentrations of IL-12 (G), and monocyte chemoattractant protein-1 (MCP-1, H).
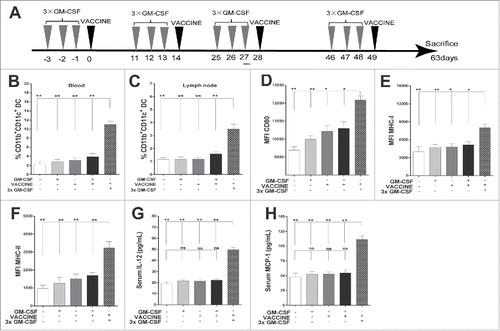
Figure 1. 3 × GM-CSF+VACCINE promotes the activation of CD11b+ CD11c+DC. (A) Schematic illustration of the full immunization workflow in AAV8–1.3HBV infected mice. (B, H) Three days after the second immunization, blood and inguinal lymph nodes were collected from the different immunization groups and analyzed. The percentages of CD11b+CD11c+ DC in blood (B) and inguinal lymph nodes (C) are shown. (D-F) Comparison of markers on CD11b+CD11c+ DC in blood: CD80 (D), MHC-I (E), and MHC-II (F). (G-H) Serum concentrations of IL-12 (G), and monocyte chemoattractant protein-1 (MCP-1, H).

Figure 2. 3 × GM-CSF+VACCINE drives the production of CD11b+ Ly6Chi monocytes. (A-F) CD11b+Ly6Gmonocytes were sorted from PBMC of male wild-type C57BL/6 (n = 50) and treated in vitro with mGM-CSF (50 ng/mL) once and mGM-CSF (50 ng/mL) once per day for 3 d. LPS (1 μg/mL) was used as a positive control. (A) The percentage of CD11c+ DC induced by different cytokine formulations. (B-D) Comparison of CD80 (B), MHC-I (C), and MHC-II (D) on CD11c+ MoDC. (E, F) MoDC were further cultured for 72 hours with splenic CD8+T cells from AAV8–1.3HBV mice at a DC: T ratio of 1:10 and with HBsAg (10 μg/mL) then proliferative responses were assessed. Cells treated with 1μg/mL of CD3 and 100 ng/mL of CD28 were used as a positive control. (E) Representative flow cytometry results of CD8+ T cells proliferative experiment are shown. (F) The 3 × GM-CSF-induced MoDC promoted a significantly higher level of CD8+ T-cell proliferation than those induced by the single GM-CSF treatment. CD11b+Ly6Chi monocytes and CD11b+Ly6Clo monocytes in blood from AAV8–1.3HBV-infected mice that was collected 24 hours after the second immunization with 3 × GM-CSF+VACCINE were quantified by flow cytometry (G) and percentage of total CD11b+ cells (H). Numbers adjacent to outlined area indicate percent CD11b+Ly6Chi monocytes (top), and CD11b+Ly6Clo monocytes (bottom). Bars are shown as mean ± SEM. *, P<0.05; **, P<0.01; ***, P<0.001; ns, not significant.
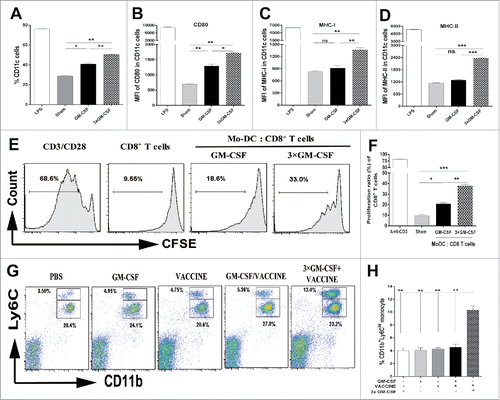
Figure 2. 3 × GM-CSF+VACCINE drives the production of CD11b+ Ly6Chi monocytes. (A-F) CD11b+Ly6G−monocytes were sorted from PBMC of male wild-type C57BL/6 (n = 50) and treated in vitro with mGM-CSF (50 ng/mL) once and mGM-CSF (50 ng/mL) once per day for 3 d. LPS (1 μg/mL) was used as a positive control. (A) The percentage of CD11c+ DC induced by different cytokine formulations. (B-D) Comparison of CD80 (B), MHC-I (C), and MHC-II (D) on CD11c+ MoDC. (E, F) MoDC were further cultured for 72 hours with splenic CD8+T cells from AAV8–1.3HBV mice at a DC: T ratio of 1:10 and with HBsAg (10 μg/mL) then proliferative responses were assessed. Cells treated with 1μg/mL of CD3 and 100 ng/mL of CD28 were used as a positive control. (E) Representative flow cytometry results of CD8+ T cells proliferative experiment are shown. (F) The 3 × GM-CSF-induced MoDC promoted a significantly higher level of CD8+ T-cell proliferation than those induced by the single GM-CSF treatment. CD11b+Ly6Chi monocytes and CD11b+Ly6Clo monocytes in blood from AAV8–1.3HBV-infected mice that was collected 24 hours after the second immunization with 3 × GM-CSF+VACCINE were quantified by flow cytometry (G) and percentage of total CD11b+ cells (H). Numbers adjacent to outlined area indicate percent CD11b+Ly6Chi monocytes (top), and CD11b+Ly6Clo monocytes (bottom). Bars are shown as mean ± SEM. *, P<0.05; **, P<0.01; ***, P<0.001; ns, not significant.

Figure 3. 3 × GM-CSF+VACCINE induces robust HBV specific CD8+ T-cell response in vivo. (A,B) 14 d after the fourth immunization, spleen cells were stimulated with 10 μg/mL HBsAg for 18 hours in vitro or with PMA (100 ng/mL) and Ionomycin (1 μg/mL) for 6 hours as a positive control. (A) Representative flow cytometry results of IFN-γ+/CD8+ T cells are shown. (B) The percentage of CD8+ T cells that were IFN-γ+ is presented. (C) IHC for CD8+ T cells (brown staining) on liver sections at 14 d after the fourth immunization. Scale bar represents 50 μm. (D) In vivo CTL strategy is illustrated. (E-F) Percentage of HBsAg-specific CTL activity in vivo is summarized. Bars are shown as mean ± SEM. *, P<0.05; **, P<0.01; ns, not significant.
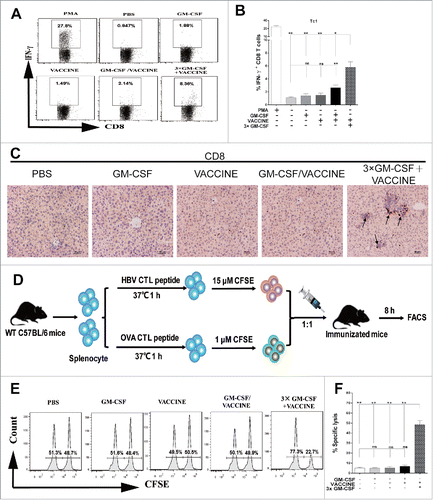
Figure 3. 3 × GM-CSF+VACCINE induces robust HBV specific CD8+ T-cell response in vivo. (A,B) 14 d after the fourth immunization, spleen cells were stimulated with 10 μg/mL HBsAg for 18 hours in vitro or with PMA (100 ng/mL) and Ionomycin (1 μg/mL) for 6 hours as a positive control. (A) Representative flow cytometry results of IFN-γ+/CD8+ T cells are shown. (B) The percentage of CD8+ T cells that were IFN-γ+ is presented. (C) IHC for CD8+ T cells (brown staining) on liver sections at 14 d after the fourth immunization. Scale bar represents 50 μm. (D) In vivo CTL strategy is illustrated. (E-F) Percentage of HBsAg-specific CTL activity in vivo is summarized. Bars are shown as mean ± SEM. *, P<0.05; **, P<0.01; ns, not significant.

Figure 4. Responses of AAV8–1.3HBV infected mice to the complete 3 × GM-CSF +VACCINE regimen. 14 d after the fourth immunization, serum HBeAg (A) HBsAg (B), and HBsAb (C) were tested by ELISA. (D-G) At intervals up to 24 weeks, serum IgG subclasses (D), HBeAg (E), and HBsAg (F) and ALT (G) were measured by ELISA. 14 d after the fourth immunization, HBV DNA in livers (H) and serum samples (I) was analyzed with q-PCR. Dotted lines in (I) represent the assay limit of detection. (J-K) 14 d after the fourth immunization, liver-infiltrating lymphocytes were stained by H&E. Scale bar represents 50 μm (J). Liver sections were stained for HBcAg (brown staining) by IHC. Scale bar represents 50 μm (K). Symbols represent mean ± SEM. **, P<0.01; ns, not significant.
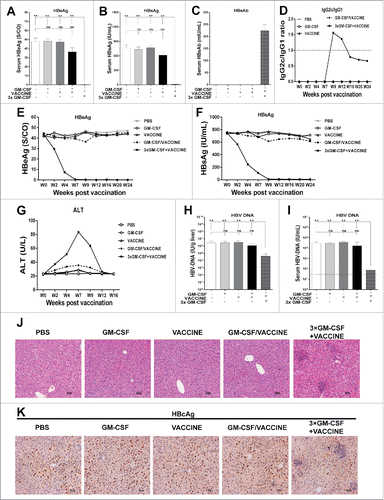
Figure 4. Responses of AAV8–1.3HBV infected mice to the complete 3 × GM-CSF +VACCINE regimen. 14 d after the fourth immunization, serum HBeAg (A) HBsAg (B), and HBsAb (C) were tested by ELISA. (D-G) At intervals up to 24 weeks, serum IgG subclasses (D), HBeAg (E), and HBsAg (F) and ALT (G) were measured by ELISA. 14 d after the fourth immunization, HBV DNA in livers (H) and serum samples (I) was analyzed with q-PCR. Dotted lines in (I) represent the assay limit of detection. (J-K) 14 d after the fourth immunization, liver-infiltrating lymphocytes were stained by H&E. Scale bar represents 50 μm (J). Liver sections were stained for HBcAg (brown staining) by IHC. Scale bar represents 50 μm (K). Symbols represent mean ± SEM. **, P<0.01; ns, not significant.

Figure 5. Blockage of Ly6Chi monocytes abrogates HBV clearance by the 3 × GM-CSF+VACCINE. The AAV8–1.3HBV infected mice were treated with CCR2 antagonist (INCB 3344, 30 mg/kg) by intraperitoneal injection one hour before GM-CSF, repeated at day 2, 3, and 4. The CD11b+Ly6Chi monocytes were measured 12 hours after the fourth INCB 3344 administration. (A) CD11b+Ly6Chi monocytes were quantified by percentage of total CD11b+ cells. (B) CD11b+ CD11c+ DC in blood were analyzed 48 hours after the fourth INCB 3344 administration and quantified by percentage of total CD11b+ cells. (C-F) IFN-γ+CD8+ T cells (C) in spleen, serum ALT (D), serum HBsAg (E), and serum HBV DNA (F) were measured on 14 d after the fourth vaccination. Dotted lines in (F) represent the assay limit of detection. (G) 14 d after the fourth vaccination, the liver sections HBcAg (brown staining) were stained by IHC. Scale bar represents 50 μm. Bars represent the mean ± SEM. *, P<0.05; **, P<0.01; ns, not significant.
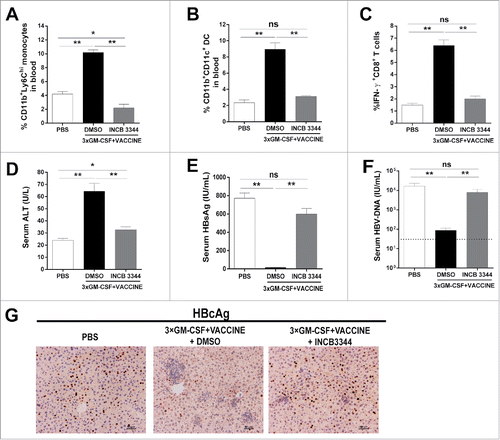
Figure 5. Blockage of Ly6Chi monocytes abrogates HBV clearance by the 3 × GM-CSF+VACCINE. The AAV8–1.3HBV infected mice were treated with CCR2 antagonist (INCB 3344, 30 mg/kg) by intraperitoneal injection one hour before GM-CSF, repeated at day 2, 3, and 4. The CD11b+Ly6Chi monocytes were measured 12 hours after the fourth INCB 3344 administration. (A) CD11b+Ly6Chi monocytes were quantified by percentage of total CD11b+ cells. (B) CD11b+ CD11c+ DC in blood were analyzed 48 hours after the fourth INCB 3344 administration and quantified by percentage of total CD11b+ cells. (C-F) IFN-γ+CD8+ T cells (C) in spleen, serum ALT (D), serum HBsAg (E), and serum HBV DNA (F) were measured on 14 d after the fourth vaccination. Dotted lines in (F) represent the assay limit of detection. (G) 14 d after the fourth vaccination, the liver sections HBcAg (brown staining) were stained by IHC. Scale bar represents 50 μm. Bars represent the mean ± SEM. *, P<0.05; **, P<0.01; ns, not significant.
Supplemental material

2016HV0580R1-s02.docx

Download MS Word (544.6 KB)