1,079
Views
4
CrossRef citations to date
0
Altmetric
Research Papers

Combinatorial peptide-based epitope mapping from Ebola virus DNA vaccines and infections reveals residue-level determinants of antibody binding

, , , , &
Pages 2953-2966 | Received 02 Mar 2017, Accepted 23 Jul 2017, Published online: 14 Nov 2017

Figures & data

Table 1. CLIPS peptides.

Table 2. Samples tested for epitope mapping.

Figure 1. Combinatorial peptide-based epitope mapping of monoclonal and polyclonal sera. Representative examples of epitope mapping of mAbs and polyclonal sera are shown. OD signals, in arbitrary units (AU) are shown for screens of mAb 13F6 against the LIB1 CLIPS library (A), mAb 6D8 against the LIB2 CLIPS library (B), polyclonal sera from a negative control rhesus (rhVector) and polyclonal sera from a Ebola-infected rhesus (rhH117X) against the LIB1 CLIPS library (C and D, respectively). Peptides containing epitopes identified through the combinatorial analysis are colored as described in the respective legends for each sample; all other peptides are shown in black
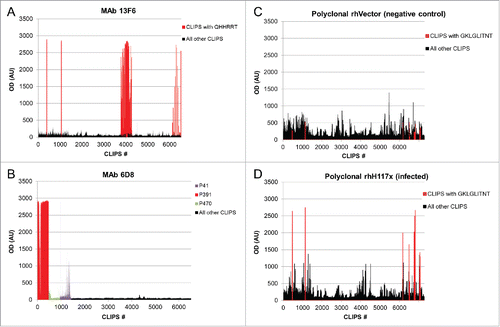
Figure 1. Combinatorial peptide-based epitope mapping of monoclonal and polyclonal sera. Representative examples of epitope mapping of mAbs and polyclonal sera are shown. OD signals, in arbitrary units (AU) are shown for screens of mAb 13F6 against the LIB1 CLIPS library (A), mAb 6D8 against the LIB2 CLIPS library (B), polyclonal sera from a negative control rhesus (rhVector) and polyclonal sera from a Ebola-infected rhesus (rhH117X) against the LIB1 CLIPS library (C and D, respectively). Peptides containing epitopes identified through the combinatorial analysis are colored as described in the respective legends for each sample; all other peptides are shown in black

Figure 2. Initial epitope mapping of EBOV GP: The non-weighted (R) and weighted (Q) scores derived from the OD signals produced during screening of CLIPS from LIB1 are shown.
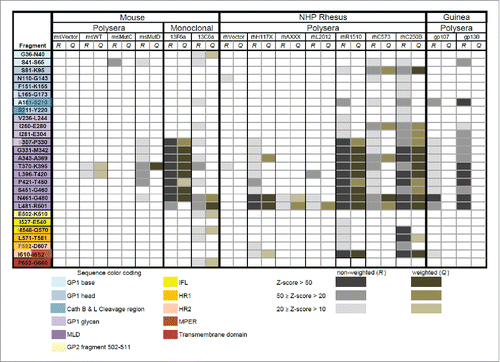
Figure 2. Initial epitope mapping of EBOV GP: The non-weighted (R) and weighted (Q) scores derived from the OD signals produced during screening of CLIPS from LIB1 are shown.

Figure 3. Fine epitope mapping of EBOV GP: The non-weighted (R) and weighted (Q) scores derived from the OD signals produced during screening of CLIPS from LIB2 are shown.
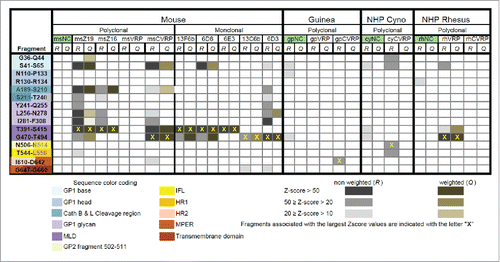
Figure 3. Fine epitope mapping of EBOV GP: The non-weighted (R) and weighted (Q) scores derived from the OD signals produced during screening of CLIPS from LIB2 are shown.

Table 3. Epitope regions in Ebola GP.

Table 4. Monoclonal Ab epitopes.

Figure 4. Antigenic regions of GP derived from CLIPS screening. A surface model of the GP trimer is shown in white. Smooth regions of the model correspond to regions of the structure determined experimentally.Citation6 Regions that were modeled “de novo” are shown as collections of dots are used to visualize the approximate location where missing epitopes are located. The 3D representation omits the MLD, which is considered unstructured. Nine of the 13 epitopes identified as the most antigenic regions of the GP sequence, based on our analysis, are indicated in various colors. The remaining 2 epitopes identified with CLIPS fall within the MLD, and are not shown in the present structural model. A separate model is shown from epitopes from (A) EBOV DNA and replicon vaccines and (B) for EBOV infections.
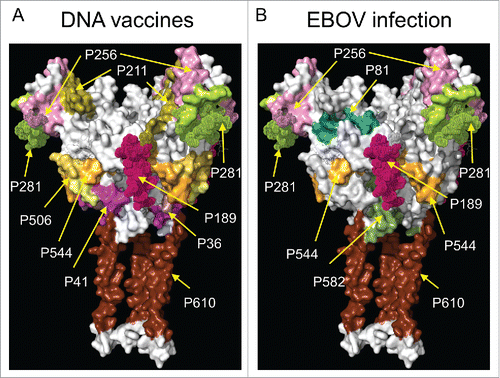
Figure 4. Antigenic regions of GP derived from CLIPS screening. A surface model of the GP trimer is shown in white. Smooth regions of the model correspond to regions of the structure determined experimentally.Citation6 Regions that were modeled “de novo” are shown as collections of dots are used to visualize the approximate location where missing epitopes are located. The 3D representation omits the MLD, which is considered unstructured. Nine of the 13 epitopes identified as the most antigenic regions of the GP sequence, based on our analysis, are indicated in various colors. The remaining 2 epitopes identified with CLIPS fall within the MLD, and are not shown in the present structural model. A separate model is shown from epitopes from (A) EBOV DNA and replicon vaccines and (B) for EBOV infections.

Table 5. X-ray crystallography and cryo-EM structures used for epitope mapping.

Figure 5. (A) Electron density map (colored green and red) of the complex of mAbs c4G7 and c13C6 with the GP trimer. The c4G7 mAbs bind to the middle of the chalice viewed here from a side view. Two c4G7 mAbs are modeled by a smooth surface representation colored in gray, and fitted within the electron density map. The third c4G7 model has been omitted, and the corresponding regions of the electron density map were sliced to show the antibody binding site formed by epitopes P41, P506, and P544. (B) Electron density map (in blue) of the complex of mAb ADI-15731 with the GP trimer viewed from the top. Two ADI-15731 mAbs, modeled as smooth surfaces in gray, are fitted within the electron density map on top of the glycan cap of GP. A third mAb has been omitted and the electron density map sliced to show the antibody-binding site formed primarily by epitopes P256 and P281.
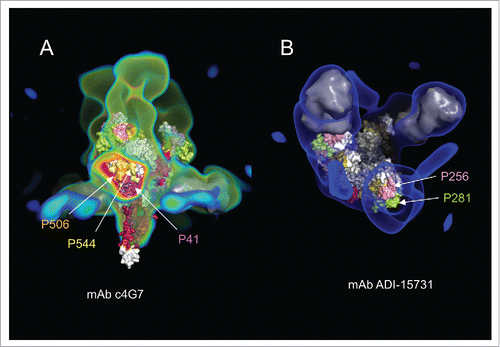
Figure 5. (A) Electron density map (colored green and red) of the complex of mAbs c4G7 and c13C6 with the GP trimer. The c4G7 mAbs bind to the middle of the chalice viewed here from a side view. Two c4G7 mAbs are modeled by a smooth surface representation colored in gray, and fitted within the electron density map. The third c4G7 model has been omitted, and the corresponding regions of the electron density map were sliced to show the antibody binding site formed by epitopes P41, P506, and P544. (B) Electron density map (in blue) of the complex of mAb ADI-15731 with the GP trimer viewed from the top. Two ADI-15731 mAbs, modeled as smooth surfaces in gray, are fitted within the electron density map on top of the glycan cap of GP. A third mAb has been omitted and the electron density map sliced to show the antibody-binding site formed primarily by epitopes P256 and P281.

Figure 6. Plot of residue-type conservation as a function of position in the EBOV GP sequence derived from a multiple sequence alignment of the Ebolavirus genus. The 13 regions from the EBOV GP sequence identified as highly antigenic are indicated in red over the horizontal axis. The residue conservation on these epitopes is color-coded based on the EBOV species.
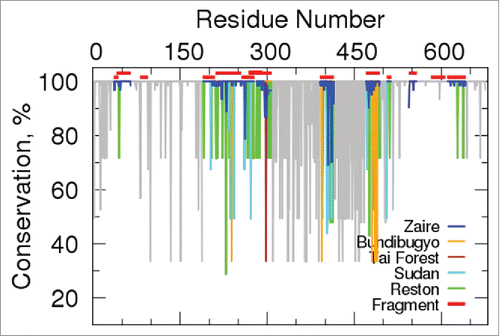
Figure 6. Plot of residue-type conservation as a function of position in the EBOV GP sequence derived from a multiple sequence alignment of the Ebolavirus genus. The 13 regions from the EBOV GP sequence identified as highly antigenic are indicated in red over the horizontal axis. The residue conservation on these epitopes is color-coded based on the EBOV species.

Figure 7. Summary of the multiple sequence alignment analysis of the Ebolavirus genus. Sequences of the 13 epitopes identified in the CLIPS study are listed using a single-letter residue code. Letters inside the black boxes indicate the non-conserved residues in Zaire ebolavirus. Below the sequence of each fragment, we indicate the observed residue substitutions in the Bundibugyo, Tai Forest, Reston, and Sudan species. Dashes indicate positions with residue variability in species other than Zaire ebolavirus.
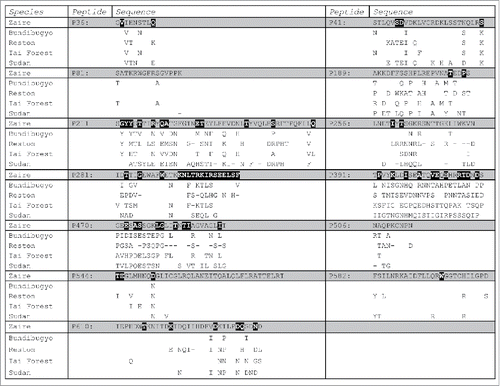
Figure 7. Summary of the multiple sequence alignment analysis of the Ebolavirus genus. Sequences of the 13 epitopes identified in the CLIPS study are listed using a single-letter residue code. Letters inside the black boxes indicate the non-conserved residues in Zaire ebolavirus. Below the sequence of each fragment, we indicate the observed residue substitutions in the Bundibugyo, Tai Forest, Reston, and Sudan species. Dashes indicate positions with residue variability in species other than Zaire ebolavirus.
Supplemental material

Supplemental_Material.pptx

Download MS Power Point (4.1 MB)