1,155
Views
0
CrossRef citations to date
0
Altmetric
Research Papers

The dynamics of immunoglobulin V-gene usage and clonotype expansion in mice after prime and boost immunizations as analyzed by NGS

, , &
Pages 2987-2995 | Received 24 Jul 2017, Accepted 11 Sep 2017, Published online: 30 Oct 2017

Figures & data

Figure 1. Schematic of the study design. Two DNA immunizations were administered by gene gun followed by a protein boost without adjuvant.

Figure 1. Schematic of the study design. Two DNA immunizations were administered by gene gun followed by a protein boost without adjuvant.

Figure 2. A) V-gene segment usage in gamma reads from peripheral blood cells of vector control-immunized mice and gp120-immunized mice. The distribution in vector control-immunized mice is oligoclonal and very different from that of gp120-immunized mice. B) Same as A, but in kappa reads.
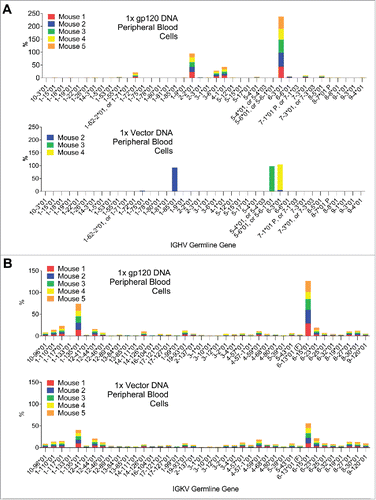
Figure 2. A) V-gene segment usage in gamma reads from peripheral blood cells of vector control-immunized mice and gp120-immunized mice. The distribution in vector control-immunized mice is oligoclonal and very different from that of gp120-immunized mice. B) Same as A, but in kappa reads.

Figure 3. Comparison of the gamma chain V-segment germline gene usage by IgG expressing B-cells in peripheral blood cells 7 days after the first DNA immunization or in spleen plasmablasts 4 days after the 2nd DNA and boost. Germline genes which are dominant in both time points are highlighted.

Figure 3. Comparison of the gamma chain V-segment germline gene usage by IgG expressing B-cells in peripheral blood cells 7 days after the first DNA immunization or in spleen plasmablasts 4 days after the 2nd DNA and boost. Germline genes which are dominant in both time points are highlighted.

Figure 4. Comparison of the V-segment kappa germline gene usage by B-cells in peripheral blood cells 7 days after the first DNA immunization or in spleen plasmablasts 4 days after the 2nd DNA and boost. Germline genes which are dominant in both time points are highlighted.

Figure 4. Comparison of the V-segment kappa germline gene usage by B-cells in peripheral blood cells 7 days after the first DNA immunization or in spleen plasmablasts 4 days after the 2nd DNA and boost. Germline genes which are dominant in both time points are highlighted.

Figure 5. Relative abundance of germline gene assignments in two subpopulations—plasmablasts (B220+CD138+) or other B cells (B220+CD138)—from mice immunized with two doses of gp120 DNA. Each color represents an individual mouse. 4 out of 5 mice showed increased germline gene usage in plasmablasts for either one or both of the germline genes shown. P value denotes statistical significance of a 2-way ANOVA for the variable “subpopulation” (plasmablasts vs. CD138 B cells) for the gamma chain, or for a paired one-tailed t-test for the kappa chain.

Figure 5. Relative abundance of germline gene assignments in two subpopulations—plasmablasts (B220+CD138+) or other B cells (B220+CD138−)—from mice immunized with two doses of gp120 DNA. Each color represents an individual mouse. 4 out of 5 mice showed increased germline gene usage in plasmablasts for either one or both of the germline genes shown. P value denotes statistical significance of a 2-way ANOVA for the variable “subpopulation” (plasmablasts vs. CD138− B cells) for the gamma chain, or for a paired one-tailed t-test for the kappa chain.
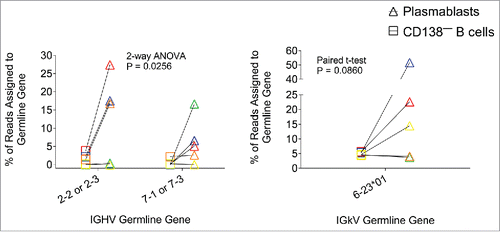
Figure 6. A: Relative frequencies of the dominant CDRH3s from gamma reads after the 1st immunization. None of the dominant CDRH3s were observed in vector control-immunized mice. B: Relative frequencies of the dominant CDRL3s from kappa reads after the 1st immunization. All of the dominant CDRL3s in gp120-immunized mice were also present in vector control-immunized mice, albeit at lower frequencies (data not shown).

Figure 6. A: Relative frequencies of the dominant CDRH3s from gamma reads after the 1st immunization. None of the dominant CDRH3s were observed in vector control-immunized mice. B: Relative frequencies of the dominant CDRL3s from kappa reads after the 1st immunization. All of the dominant CDRL3s in gp120-immunized mice were also present in vector control-immunized mice, albeit at lower frequencies (data not shown).

Figure 7. The relative frequency of CDR3s common to two or more mice (“public” CDR3s) after 1 or 2 gp120 DNA doses. Each color represents an individual mouse. Top: public CDRH3s for IgG-expressing B cell heavy chain. After the first immunization all public CDRH3s appeared at a very similar frequency in all 5 mice, whereas after the second DNA immunization the scatter was considerable—each individual mouse displayed different frequencies of the different public CDRH3s. Bottom: public CDRL3s for B-cells expressing kappa chain. CQQYSSYPLTF is a rare CDRL3 after the first immunization that goes on to become dominant and shared by 3 out of 5 mice.

Figure 7. The relative frequency of CDR3s common to two or more mice (“public” CDR3s) after 1 or 2 gp120 DNA doses. Each color represents an individual mouse. Top: public CDRH3s for IgG-expressing B cell heavy chain. After the first immunization all public CDRH3s appeared at a very similar frequency in all 5 mice, whereas after the second DNA immunization the scatter was considerable—each individual mouse displayed different frequencies of the different public CDRH3s. Bottom: public CDRL3s for B-cells expressing kappa chain. CQQYSSYPLTF is a rare CDRL3 after the first immunization that goes on to become dominant and shared by 3 out of 5 mice.
Supplemental material

Supplemental_Material.zip

Download Zip (867 KB)