1,684
Views
1
CrossRef citations to date
0
Altmetric
Research Paper

220 mutation in the hemagglutinin of avian influenza A (H7N9) virus alters antigenicity during vaccine strain development

, , , , , , , & show all
Pages 532-539 | Received 29 Sep 2017, Accepted 13 Dec 2017, Published online: 01 Feb 2018

Figures & data

Figure 1. Modified sequence in HA and NA of reassortant viruses. (A) HA cleavage site sequence. LAPI–HA7: consensus sequence of low pathogenic avain influenza viruses H7 (reference to the sequence in NCBI gene bank, Accession Number: APR73185, AJU15335, AKI82233, APW83929, AHL21384, AJE61993, ANH96462, ALR82230, AJU15321, APW83918); RG-17SF003HA: sequence of (6+2) reassortant H7N9 virus by reverse technology with deletion of KRTA; Wild-17SF003HA: sequence of wild-type virus A/Guangdong/17SF003/2016; ↓: proteolytic cleavage site. (B) Part of amino acid sequence associated with resistance to neuraminidase inhibitors (N2 numbering: 291–293 position). Wild—17SF003NA: wild-type 17SF003 virus containing NA-292K/R; RG-17SF003NA: (6+2) reassortant 17SF003 virus containing NA-292R. Change sequences were in bold.
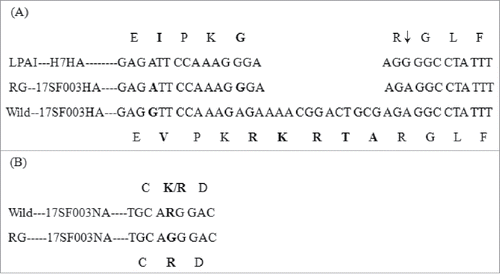
Figure 1. Modified sequence in HA and NA of reassortant viruses. (A) HA cleavage site sequence. LAPI–HA7: consensus sequence of low pathogenic avain influenza viruses H7 (reference to the sequence in NCBI gene bank, Accession Number: APR73185, AJU15335, AKI82233, APW83929, AHL21384, AJE61993, ANH96462, ALR82230, AJU15321, APW83918); RG-17SF003HA: sequence of (6+2) reassortant H7N9 virus by reverse technology with deletion of KRTA; Wild-17SF003HA: sequence of wild-type virus A/Guangdong/17SF003/2016; ↓: proteolytic cleavage site. (B) Part of amino acid sequence associated with resistance to neuraminidase inhibitors (N2 numbering: 291–293 position). Wild—17SF003NA: wild-type 17SF003 virus containing NA-292K/R; RG-17SF003NA: (6+2) reassortant 17SF003 virus containing NA-292R. Change sequences were in bold.

Table 1. Amino acid difference and virus titers of reassortant viruses.

Table 2. Antigenic analysis of candidate vaccine viruses by hemagglutination inhibition.

Figure 2. Growth characteristics of different viruses in MDCK cells. V1E1: RG-17SF003V1E1 with initial rescued in Vero cells followed by 1 passage growth in eggs; V1E5: RG-17SF003V1E5 with initial rescued in Vero cells followed by 5 passages growth in eggs; PR8: A/Puerto Rico/8/34 generated by RG. MDCK cell monolayers were infected at a multiplicity of infection of 0.001 of different viruses. The data was the results of three independent tests and analyzed by two-way ANOVA using GraphPad Prism 5 software package (version 5.0). ** represents p < 0.01; * represents p < 0.05.
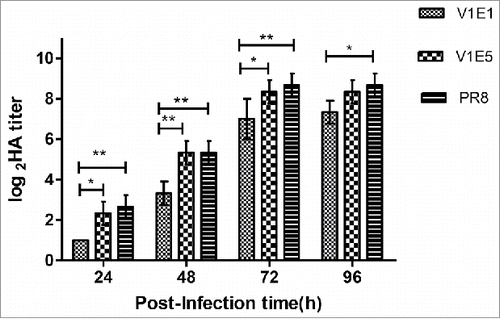
Figure 2. Growth characteristics of different viruses in MDCK cells. V1E1: RG-17SF003V1E1 with initial rescued in Vero cells followed by 1 passage growth in eggs; V1E5: RG-17SF003V1E5 with initial rescued in Vero cells followed by 5 passages growth in eggs; PR8: A/Puerto Rico/8/34 generated by RG. MDCK cell monolayers were infected at a multiplicity of infection of 0.001 of different viruses. The data was the results of three independent tests and analyzed by two-way ANOVA using GraphPad Prism 5 software package (version 5.0). ** represents p < 0.01; * represents p < 0.05.

Figure 3. Replication of reassortant viruses in MDCK cells with or without TPCK-trypsin. V1E1: RG-17SF003V1E1 with initial growth in Vero cells followed by 1 passage in eggs; V1E5: RG-17SF003V1E5 with initial growth in Vero cells followed by 5 passages in eggs; PR8: A/Puerto Rico/8/34 generated by RG. The original viruses were diluted from 10−1to 10−5 and each diluted viruses were inoculated in MDCK cells. Mock cells were inoculated with PBS.
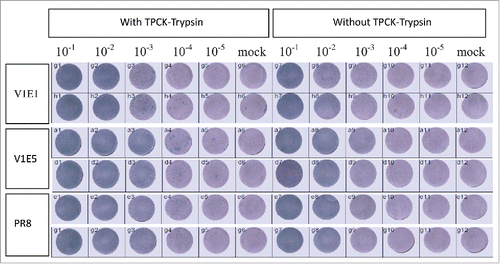
Figure 3. Replication of reassortant viruses in MDCK cells with or without TPCK-trypsin. V1E1: RG-17SF003V1E1 with initial growth in Vero cells followed by 1 passage in eggs; V1E5: RG-17SF003V1E5 with initial growth in Vero cells followed by 5 passages in eggs; PR8: A/Puerto Rico/8/34 generated by RG. The original viruses were diluted from 10−1to 10−5 and each diluted viruses were inoculated in MDCK cells. Mock cells were inoculated with PBS.

Table 3. Virulence assessment of RG-SF003 in chicken embryos and chickens.

Figure 4. A Total protein content (left Y axis) and HA proportion (right Y axis). Total protein content per 10 eggs of each virus. HA proportion was determined using the following equation: HA1+HA2 /HA1+HA2+NP+M. B SDS-PAGE profile of various influenza viruses using the same sample amount. M: Marker (KD). PR8: A/Puerto Rico/8/34 generated by RG; V1E1: RG-17SF003V1E1 with initial rescued in Vero cells followed by 1 passage growth in eggs; V1E5: RG-17SF003V1E5 with initial rescued in Vero cells followed by 5 passages growth in eggs. The data was the results of two independent tests and analyzed by two-way ANOVA using GraphPad Prism 5 software package (version 5.0).** represents p < 0.01; *** represents p < 0.001.
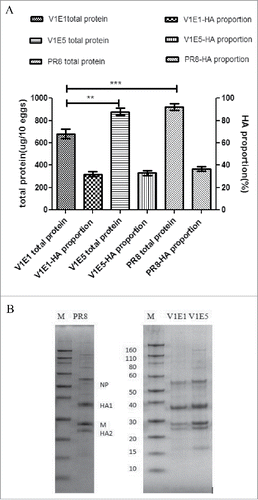
Figure 4. A Total protein content (left Y axis) and HA proportion (right Y axis). Total protein content per 10 eggs of each virus. HA proportion was determined using the following equation: HA1+HA2 /HA1+HA2+NP+M. B SDS-PAGE profile of various influenza viruses using the same sample amount. M: Marker (KD). PR8: A/Puerto Rico/8/34 generated by RG; V1E1: RG-17SF003V1E1 with initial rescued in Vero cells followed by 1 passage growth in eggs; V1E5: RG-17SF003V1E5 with initial rescued in Vero cells followed by 5 passages growth in eggs. The data was the results of two independent tests and analyzed by two-way ANOVA using GraphPad Prism 5 software package (version 5.0).** represents p < 0.01; *** represents p < 0.001.