Figures & data
Table 1. Reactogenicity in left tibialis anterior following i.m. injection of SLA/LA. Local reactions following i.m. injection were assigned a grade (0–3) based on the following criteria. No reaction (0): no swelling, normal skin; mild(Citation1): slightly reddish and/or swollen muscle; moderate(Citation2): red thickened skin with slightly open wound; severe(Citation3): ulceration or abscess. N = 6–12/group.
Figure 2. Body weight & temperature of mice after i.m. injection of SLA/LA. C57BL/6 mice were injected i.m. with 0, 1 or 10 mg SLA/LA. The percent change (mean ± standard deviation) in body weight (Panel A) and temperature (Panel B) were plotted over the course of the study (n = 12 at Days 0 and 1, at which point 6 mice were euthanized for sample collection).
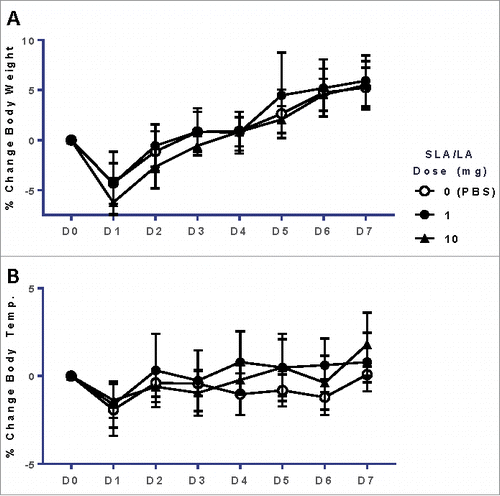
Table 2. Blood chemistry & hematology in SLA/LA treated mice. Multiple parameters were measured in mouse blood 1 or 7 days following i.m. injection of SLA/LA. Abbreviations: ALP (Alkaline phosphatase), ALT: (Alanine aminotransferase), BUN: (Blood urea nitrogen), WBC: (White blood cell), MCH: (Mean corpuscular hemoglobin), MCHC: (Mean corpuscular hemoglobin concentration), MCV: (Mean corpuscular volume), RBC: (Red blood cell). N = 4–6/group; *: p<0.05.
Figure 3. Hemolytic activity of SLA/LA. Erythrocytes from C57BL/6 mice or New Zealand white rabbits were incubated with 0.2–2 mg/mL SLA/LA, buffer alone (0 mg/mL) or Triton-X (positive control). The level of hemoglobin release indicating cell lysis was determined through the measurement of the OD540 in the cellular supernatant. Values obtained with buffer alone were subtracted from measured values (n = 3). Bars represent group means ± standard deviation.
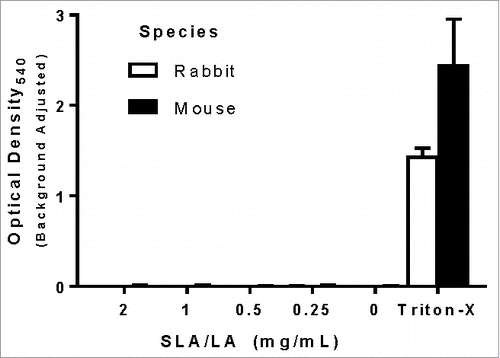
Figure 4. Histopathology of the left tibialis anterior muscle after injection of SLA/LA. C57BL/6 mice (n = 6/group) were injected i.m. with 0, 1 or 10 mg SLA/LA. Left T.A. muscles were collected and fixed 1 or 7 days following injection. H&E stained slides were prepared for each muscle and evaluated by a pathologist. A representative image of a single mouse per group imaged at the time points indicated is shown. Arrows: infiltration of inflammatory cells; open arrowheads: necrotic muscle cells; closed arrowheads: degenerated muscle cells; *: foci of acute to subacute inflammation.
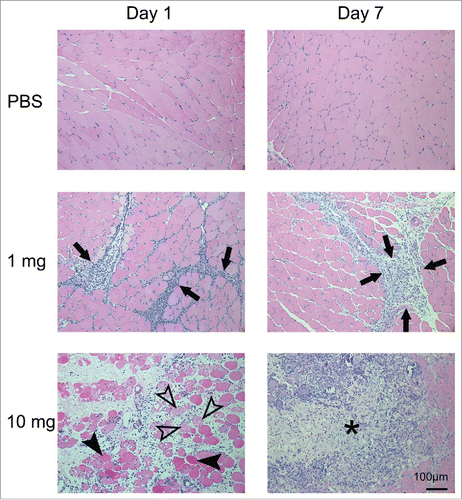
Table 3. Tissue damage & inflammation in left tibialis anterior following i.m. injection of SLA/LA. Degree of inflammation and immune cell infiltration were assessed on H&E stained slides of the left T.A., and assigned a grade (0–4) with 0 and 4 being the least and most severe, respectively. Standard deviation is indicated in parentheses; N = 6/group.
Figure 5. Cytokine/Chemokine levels in mice after i.m. injection of SLA/LA. C57BL/6 mice (n = 6/group) were injected i.m. with 0, 1 or 10 mg SLA/LA. Serum was collected at 3, 6, 24 or 168 hours post injection and the levels of 32 immune-related proteins were measured. Serum levels of G-CSF (Panel A), IL-6 (Panel B), IP-10 (Panel C) and MIP-1β (Panel D) are shown over time. Cytokine/chemokine levels were assessed in protein extracts derived from T.A. muscles 6 hours following injection of 0.25 mg SLA/LA or PBS (Panel E). *, **, ***, and **** represent p <0.05, 0.01, 0.001 and 0.0001, respectively. Bars represent group geometric means ± standard deviation.
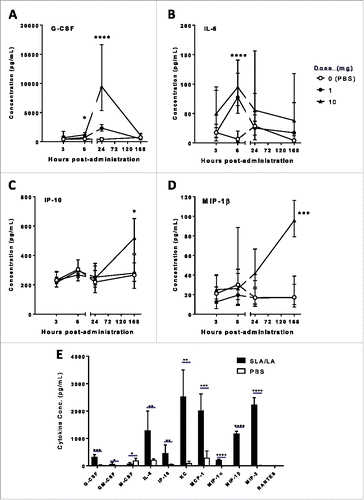
Figure 6. Immunogenicity of SLA/LA-OVA. C57BL/6 mice (n = 10/group) were injected i.m. on Days 0 and 21 with PBS, ovalbumin (20 µg) or OVA-SLA/LA (20 µg; based on antigen dose). Animals were bled on Day 35 and serum analyzed for anti-OVA IgG Abs by ELISA (Panel A; group geometric means ± standard deviation). In addition, the levels of OVA-specific CD8+ cells were assessed by tetramer analysis in the whole blood of mice collected on Day 28 (Panel B; group means ± standard deviation). Mouse survival was tracked after tumor challenge with of 106 B16-ova cells on Day 50 (Panel C). **** represents p <0.0001.
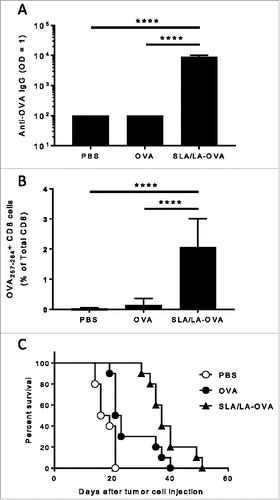
Figure 7. Biodistribution of CF770-OVA. C57BL/6 albino mice (n = 4/group) were injected i.m. on Day 0 with CF770-labeled ovalbumin (20 µg; alone or encapsulated in SLA/LA archaeosomes). Whole body imaging was conducted to localize CF770-labeled OVA at various time points. A representative image series of a single mouse per group imaged at the time points indicated is shown (Panel A). From the whole body imaging, the levels of fluorescence were measured at the injection site (left TA) over time (Panel B; group means ± standard deviation). One week following vaccination, animals were perfused with heparinized saline, and various tissues collected for ex vivo imaging. The fluorescent signals from each organ were quantified (Panel C; group means ± standard deviation). *, ***, and **** represent p <0.05, 0.001 and 0.0001, respectively.
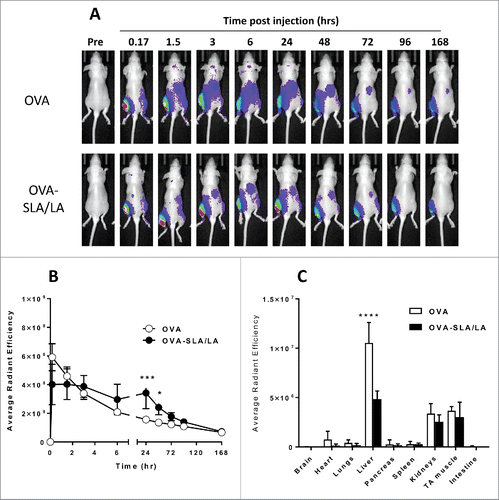
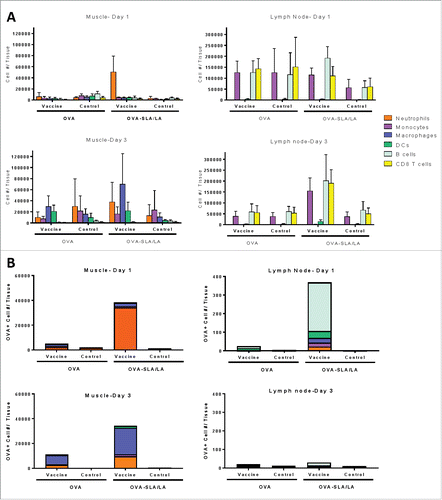
Figure 8. Immune cell recruitment and antigen uptake induced by SLA/LA. C57BL/6 mice (n = 4–5/group) were injected i.m. in the left tibialis anterior (TA) muscle on Day 0 with AF647-labeled OVA (20 µg; alone or encapsulated in SLA/LA archaeosomes). The right TA of all animals was injected with PBS for use as a negative control. The TAs and draining inguinal lymph nodes (right and left) were collected on Days 1 or 3 following injection. Immune cells were isolated from each tissue, counted and fluorescently stained with an antibody cocktail to differentiate different immune cell populations: B cells, CD8+ T cells, dendritic cells (DC), macrophages, monocytes and neutrophils. The number of cells from the above cell populations was determined per tissue through flow cytometry (A; group means ± standard deviation). The number and immunophenotype of antigen-positive (OVA-AF647+) cells was determined in each tissue (B; group means).
