Figures & data
Figure 1. DNA vaccines and vaccine study design. (A) DNA vaccines. The CE DNA vaccine consists of two plasmids encoding seven different conserved sequences connected by optimized linker sequences. CE2, CE3, CE4, and CE5 differ by toggled amino acids analogous to the an HIV p24CE vaccine previously described (see Methods). The FL DNA vaccine expresses the p57 gag coding sequence from p57Gag from SIV17E-Fr. A genetic adjuvant plasmid expressing the heat-labile E. coli enterotoxin (LT) was co-delivered with both DNA vaccines (CE and FL) at each dose. (B) Comparison of p27Gag CE in HIV and SIV strains, adapted from Hu et al.Citation32 SIV p27Gag sequences from SIVmac (macaque origin) and SIVsmm (sooty mangabey), were compared to reported HIV Gag p24 CE sequences.Citation29 The SIV p27CE1 and p27CE2 toggled amino acids are indicated in red. Blue amino acids indicate SIV sequences that are dissimilar from HIV sequences. (C) The number of CE amino acids (AA) that are common in both SIV and the HIV-1 M group (see panel B), including toggle AA, for each CE is shown along with percent match between the HIV-1 p24CE and the SIV homologues. (D) Study Design. Macaques were stratified into either the CE (conserved elements) or FL (full length) DNA vaccine groups based on plasma viral load, MHC class I genotype, prior vaccination, and sex. The CE + LT DNA vaccinated animals (blue) received three doses of the CE + LT DNA vaccine administered into the epidermis of the skin by PMED at weeks 0, 4, and 8 followed by a single boost of the FL + LT DNA vaccine at week 12. The FL DNA vaccinated animals (red) received four doses of the FL SIV Gag DNA vaccine at weeks 0, 4, 8 and 12.
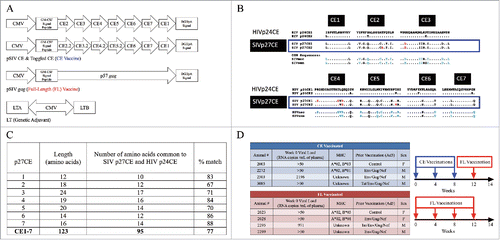
Figure 2. CE-specific IFN-γ T-cell responses in the blood. T-cell responses in Spot Forming Cells (SFC) per on million PBMC were measured before and after vaccination by IFN-γ ELISpot following stimulation with SIV CE or p57 Gag peptide pools. Shown are the mean spot forming cells (SFC) per 106 PBMC corresponding to (A) Gag-specific and (B) CE-specific SFC measured at baseline (week 0) and 2 weeks after the final DNA vaccine dose (week 14) in the CE group (left panels) and FL group (middle panels). (C) The specificities of the CE-specific responses in each animal in the CE group (left panel) and the FL group (right panel) at week 14 were measured against each separate CE peptide pool. (D) Shown are the breadth of CE-specific responses (number of positive CE peptide pools) at week 14 (left panel) and the change of the CE breadth at week 14 versus week 0 (right panel). (E) Analysis of the correlation between the magnitude of Gag-specific SFC prior to vaccination (Week 0) versus the increase in CE breadth post-vaccination (Week 14) was determined by Spearman Rank correlation test. Median values are indicated. P-values were determined by non-parametric Mann-Whitney T tests. P values ≤ 0.05 were considered significant.
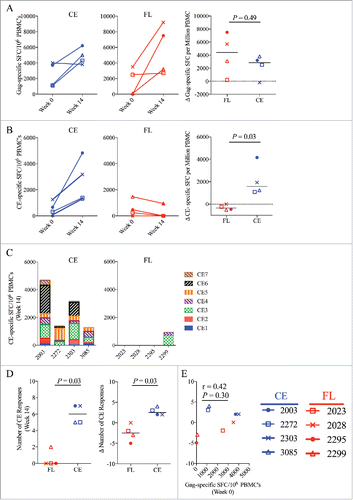
Figure 3. CE-specific IFN-γ T-cell responses in tissues. (A) The total magnitude of Gag-specific IFN-γ T-cell responses as Spot Forming Cells (SFC) were determined by IFN-γ ELISpot at Week 14 following stimulation with pools of Gag peptides at Week 14 in the axillary (left panel) and mesenteric (right panel) lymph nodes (LN). (B) CE-specific T-cell responses are shown as cumulative number of SFC against each CE peptide pool and was determined by summing the responses against each individual CE (1-7) peptide pool in the axillary (left panel) and mesenteric (middle panel) lymph nodes and the jejunum (right panel). (C) The breadth of CE-specific IFN-γ T-cell responses was determined by measuring spot forming cells (SFC) against each individual CE peptide pool in the axillary (left panel) and mesenteric (right panel) lymph nodes. The dotted line at seven indicates the maximum number of CE that can be recognized. (D) The specificity of the CE responses was mapped in the axillary (left two panels) and mesenteric (right two panels) lymph nodes by ELISpot at week 14. Shown are responses against each peptide pool in animals immunized with either the CE or FL DNA vaccines. Median values are indicated in panels A-C with red horizontal lines and p-values were determined by non-parametric Mann-Whitney T test. P values ≤ 0.05 were considered significant.
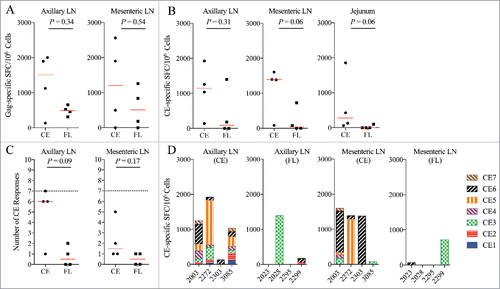
Figure 4. Multifunctional and cytolytic CE-specific CD8+ T-cell responses. The frequency of CE-specific CD8+ T-cells expressing the cytokines IFN-γ, IL-2, and/or TNF-⍺ and/or CD107a, a marker of cytolytic effector function, was determined two weeks after the final DNA vaccine dose (week 14) using cryopreserved PBMC stimulated overnight with CE peptide pools. (A-D) Shown are the frequencies of CE-specific CD8+ T-cells expressing the indicated cytokine or cytolytic functions. (E) The relative proportion of CE-specific CD8+ T-cells that are expressing the cytolytic degranulation marker, CD107a. The difference in mean response between the two groups was analyzed by a non-parametric Mann-Whitney T test. Median values are indicated with black horizontal lines and a p-value ≤ 0.05 was considered significant.
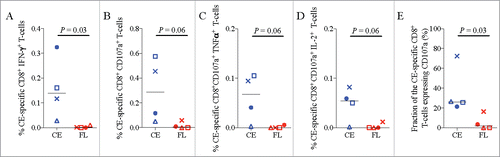
Figure 5. Plasma viral RNA load in SHIV infected macaques. Plasma viral RNA levels before and after vaccination were determined by a nucleic acid sequence-based amplification technique (NASBA) with a limit of detection of 50 copies per 1 mL of plasma.
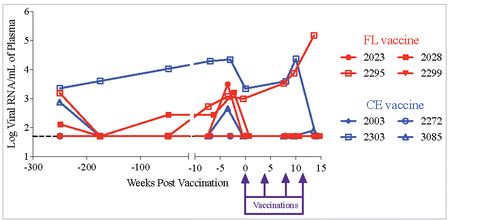
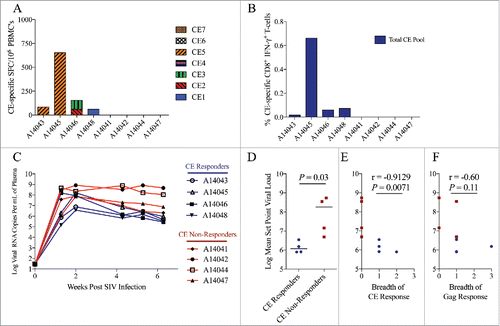
Figure 6. Higher CE-specific T-cells responses correlate with lower viral set point during acute SIV infection. CE-specific T-cell responses in rhesus macaques acutely infected with SIVΔB670 were measured six weeks following intravenous infection using (A) IFN-γ ELISpot against individual CE peptides and (B) IFN-γ ICS against a pool of all seven CE peptides. CE responders were defined as having a detectable CE response measured by ELISpot and/or ICS. (C) Viral loads were measured in the plasma by quantitative RT-PCR. (D) Mean viral set point was determined by averaging the viral loads measured at weeks 4, 5, and 6 and compared between CE responders (animals with detectable CE responses) and CE non-responders (animals with undetectable CE responses) by non-parametric Mann-Whitney T test. Horizontal lines indicate median values. Correlation between the breadth of (E) CE and (F) Gag-specific T-cell responses and mean set point plasma viral load was determined by a Spearman Rank correlation. A p value ≤ 0.05 was considered significant.