1,872
Views
14
CrossRef citations to date
0
Altmetric
Research Papers

Significant transcriptome and cytokine changes in hepatitis B vaccine non-responders revealed by genome-wide comparative analysis

ORCID Icon, , , , , , , , , & show all
Pages 1763-1772 | Received 05 Dec 2017, Accepted 02 Mar 2018, Published online: 14 May 2018

Figures & data

Figure 1. Differential genomic signatures in PBMCs between the non-responder and responder groups at 5 time points. (A-E) PBMCs from 3 participants of each group was conducted tanscriptome analysis at 5 time points, i.e. pre-vaccination, 3rd, 7th, 28th day post the first dose vaccination and 7th day post the second dose vaccination. DEGs exhibited significant differences (Fold Change ≥2.0 and p-value <0.05) between the two groups at all time points. Transcript expressions were transformed to z-score and depicted in green to black to red color scale.
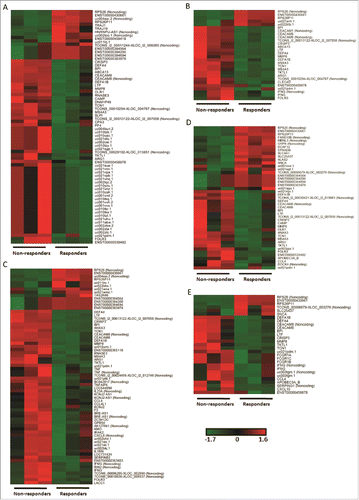
Figure 1. Differential genomic signatures in PBMCs between the non-responder and responder groups at 5 time points. (A-E) PBMCs from 3 participants of each group was conducted tanscriptome analysis at 5 time points, i.e. pre-vaccination, 3rd, 7th, 28th day post the first dose vaccination and 7th day post the second dose vaccination. DEGs exhibited significant differences (Fold Change ≥2.0 and p-value <0.05) between the two groups at all time points. Transcript expressions were transformed to z-score and depicted in green to black to red color scale.

Figure 2. Interaction networks of proteins derived from differentially expressed coding RNAs. STRING database (http://string-db.org/) was used to assess the integration of protein-protein interactions. All DEGs discovered from each time point were analyzed for the interaction of encoded proteins. The numbers of lines represented the closeness of these proteins. Line thickness indicates the strength of data support from the database.
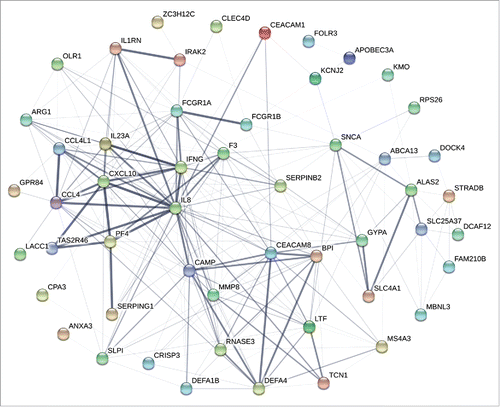
Figure 2. Interaction networks of proteins derived from differentially expressed coding RNAs. STRING database (http://string-db.org/) was used to assess the integration of protein-protein interactions. All DEGs discovered from each time point were analyzed for the interaction of encoded proteins. The numbers of lines represented the closeness of these proteins. Line thickness indicates the strength of data support from the database.

Figure 3. Comprehensive analyses and dynamic changes of the DEGs identified in non-responder and responder groups at 5 different time points. (A-B) Venn diagrams indicated the numbers of persistent up- or down-regulated expressed genes in non-responders at all time points, compared with responders. (C) Heat map showed the fold change of 11 up-regulated and 3 down-regulated DEGs in non-responders with persistent significant expression at all 5 time points, compared with responders. The change threshold was set to 2-fold.
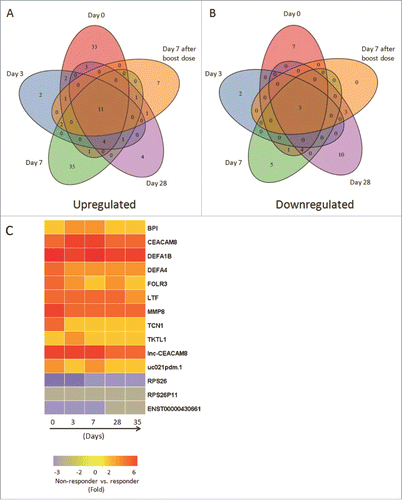
Figure 3. Comprehensive analyses and dynamic changes of the DEGs identified in non-responder and responder groups at 5 different time points. (A-B) Venn diagrams indicated the numbers of persistent up- or down-regulated expressed genes in non-responders at all time points, compared with responders. (C) Heat map showed the fold change of 11 up-regulated and 3 down-regulated DEGs in non-responders with persistent significant expression at all 5 time points, compared with responders. The change threshold was set to 2-fold.

Figure 4. Validation of up-regulated expressed genes by qRT-PCR. The expression of 9 up-regulated genes (Fold Change ≥2.0) identified by microarray assay (in black color) at 5 time points was re-evaluated by qRT-PCR (in gray color). Eight genes in qRT-PCR results confirmed the data of the microarray.
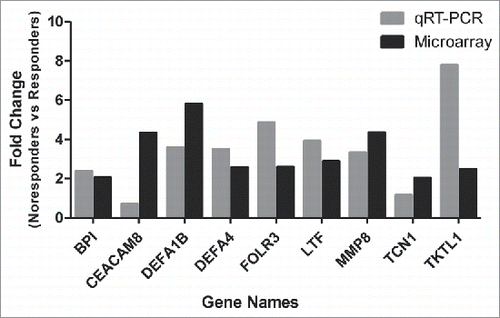
Figure 4. Validation of up-regulated expressed genes by qRT-PCR. The expression of 9 up-regulated genes (Fold Change ≥2.0) identified by microarray assay (in black color) at 5 time points was re-evaluated by qRT-PCR (in gray color). Eight genes in qRT-PCR results confirmed the data of the microarray.

Figure 5. GO analysis for differentially expressed genes between non-responders and responders at 5 different time points. (A-E)The top 10 biological process of DEGs at the time point of pre-vaccination, 3rd, 7th, 28th day post the first dose vaccination and 7th day post the second dose vaccination, respectively.
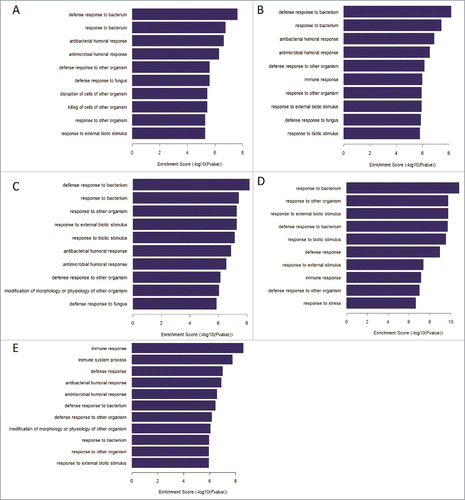
Figure 5. GO analysis for differentially expressed genes between non-responders and responders at 5 different time points. (A-E)The top 10 biological process of DEGs at the time point of pre-vaccination, 3rd, 7th, 28th day post the first dose vaccination and 7th day post the second dose vaccination, respectively.

Figure 6. Cytokine responses in plasma of HBV vaccine non-responders and responders. Plasmas from all participants were assayed by Luminex. Concentrations of cytokines were expressed as means ± SEM. Statistical analysis was performed using Mann Whitney test for non-responder and responder group at each time point.
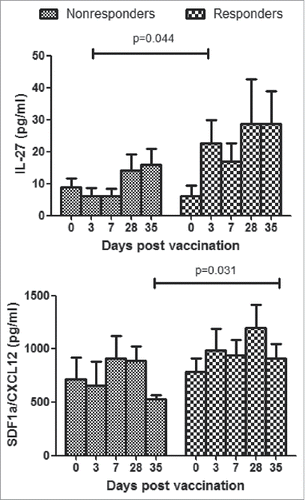
Figure 6. Cytokine responses in plasma of HBV vaccine non-responders and responders. Plasmas from all participants were assayed by Luminex. Concentrations of cytokines were expressed as means ± SEM. Statistical analysis was performed using Mann Whitney test for non-responder and responder group at each time point.

Figure 7. Study design and assays performed.

Figure 7. Study design and assays performed.
Supplemental material

KHVI_A_1450122_Supplemental.xlsx

Download MS Excel (33.3 KB)

Reprints and Corporate Permissions

Please note: Selecting permissions does not provide access to the full text of the article, please see our help page How do I view content?

To request a reprint or corporate permissions for this article, please click on the relevant link below:

Academic Permissions

Please note: Selecting permissions does not provide access to the full text of the article, please see our help page How do I view content?

Obtain permissions instantly via Rightslink by clicking on the button below:

If you are unable to obtain permissions via Rightslink, please complete and submit this Permissions form. For more information, please visit our Permissions help page.