Figures & data
Table 1. Annual influenza vaccination coverage estimates in medicare FFS, by demographic and geographic characteristics, 2006–2016.
Figure 1. Screenshot of the national flumap vaccination coverage estimates by week. This screen shot enables users to display vaccination rates in accordance to selected color-coded attributes to yield trends, a visual display of near-real time national vaccination coverage rates for influenza vaccination by selected race, 2015–2016. Source: https://www.hhs.gov/nvpo/about/resources/interactive-mapping-tool-flu-vaccination-claims-by-week/index.html?language = en.
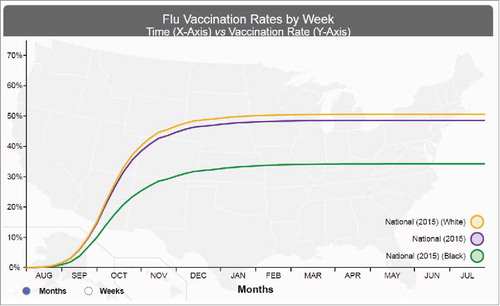
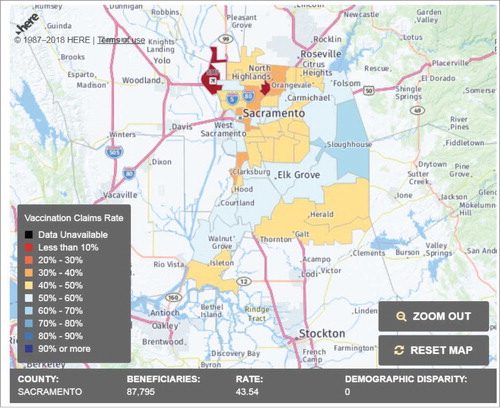
Figure 2. Screenshot of the flumap dashboards. This screen shot enables users to display vaccination rates in accordance to selected color-coded attributes to yield the flumap, a visual display of near-real time vaccination coverage estimates for influenza vaccination by county and zip code, 2015–2016 (Sacramento, California). Source: https://www.hhs.gov/nvpo/about/resources/interactive-mapping-tool-tracking-flu-vaccinations/index.html.