929
Views
0
CrossRef citations to date
0
Altmetric
Research Paper

Serological responses to rotavirus NSP2 following administration of RV3-BB human neonatal rotavirus vaccine

, , , , &
Pages 2082-2087 | Received 01 Feb 2018, Accepted 03 Apr 2018, Published online: 31 May 2018

Figures & data

Table 1. Serological responses to NSP2 proteins of different rotavirus strains following administration of RV3-BB or placebo.

Figure 1. Titres of Anti-RV3-BB antibodies in cord blood collected at birth and in serum following dosing with RV3-BB or Placebo according to the schedule described in the Materials and methods. Serum IgA (A) and serum IgG (B) in Neonatal and Infant schedules by dose and compared to Placebo. Data points represent individual serum samples, horizontal lines represent the geometric mean titre (GMT). Data is transformed onto a natural log scale. *Significant difference between geometric mean.
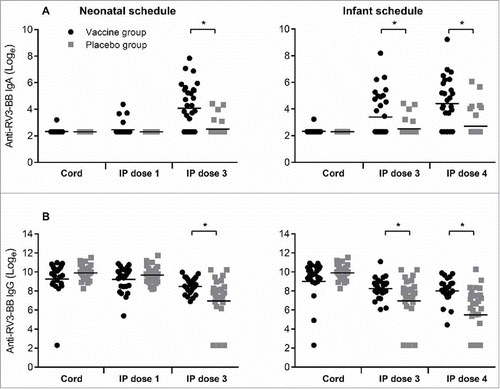
Figure 1. Titres of Anti-RV3-BB antibodies in cord blood collected at birth and in serum following dosing with RV3-BB or Placebo according to the schedule described in the Materials and methods. Serum IgA (A) and serum IgG (B) in Neonatal and Infant schedules by dose and compared to Placebo. Data points represent individual serum samples, horizontal lines represent the geometric mean titre (GMT). Data is transformed onto a natural log scale. *Significant difference between geometric mean.
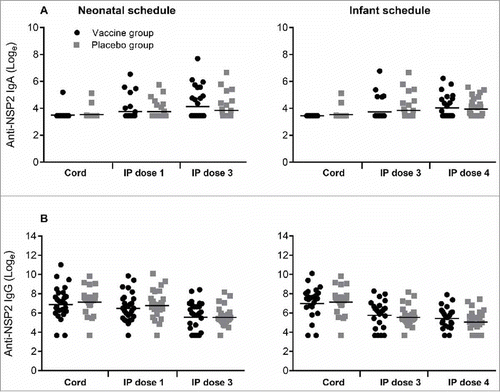
Figure 2. Titres of Anti-NSP2 antibodies in cord blood collected at birth and in serum following dosing with RV3-BB or Placebo according to the schedule described in the Materials and methods. Serum IgA (A) and serum IgG (B) in Neonatal and Infant schedules by dose and compared to Placebo. Data points represent individual serum samples, horizontal lines represent the geometric mean titre (GMT). Data is transformed onto a natural log scale. *Significant difference between geometric mean.

Figure 2. Titres of Anti-NSP2 antibodies in cord blood collected at birth and in serum following dosing with RV3-BB or Placebo according to the schedule described in the Materials and methods. Serum IgA (A) and serum IgG (B) in Neonatal and Infant schedules by dose and compared to Placebo. Data points represent individual serum samples, horizontal lines represent the geometric mean titre (GMT). Data is transformed onto a natural log scale. *Significant difference between geometric mean.