
Figures & data
Figure 1. Flowchart of study identified, screened and included.
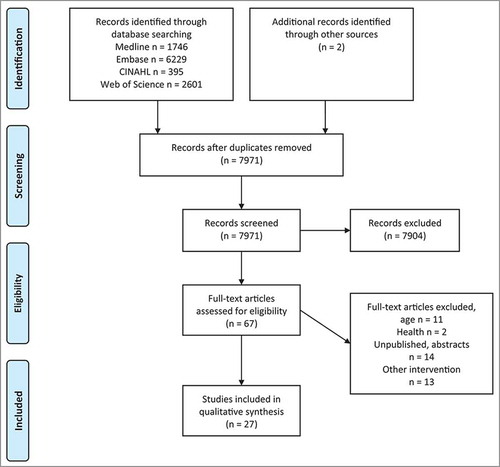
Table 1. Summary of site-specific interventions.↑, variables significantly higher/greater in the specified group compared to other groups; ↔, no significant difference between groups; ↓, variables significantly lower in specified group compared to other groups.
Table 2. Summary of patient-focused interventions.↑, variables significantly higher/greater in the specified group compared to other groups; ↔, no significant difference between groups; ↓, variables significantly lower in specified group compared to other groups.
Table 3. Summary of combined interventions.↑, variables significantly higher/greater in the specified group compared to other groups; ↔, no significant difference between groups; ↓, variables significantly lower in specified group compared to other groups.
Table 4. Summary of the Cochrane Collaborative Risk of Bias 5.1.0 tool. +, low risk of bias; −, high risk of bias; ?, unclear risk of bias.