1,473
Views
9
CrossRef citations to date
0
Altmetric
Research Article

Transcriptomal signatures of vaccine adjuvants and accessory immunostimulation of sentinel cells by toll-like receptor 2/6 agonists

&
Pages 1686-1696 | Received 05 Dec 2017, Accepted 21 May 2018, Published online: 20 Jun 2018

Figures & data

Figure 1. Structures of TLR agonists arranged by receptor target. TLR2 agonists (PAM2CSK4, PAM3CSK4, DBS-2-217C) are shown in blue, pure TLR7 agonists (C4, EY-2-40, CL307) are shown in maroon, dual TLR7/8 agonists are shown in red (IMDQ, Meta-amine, XG-2-136, Hybrid 2), and pure TLR8 agonists (KHP-3-126, MB-152, DS-877, MB-564, MB-569, A-5-epsilon) are shown in magenta.

Figure 1. Structures of TLR agonists arranged by receptor target. TLR2 agonists (PAM2CSK4, PAM3CSK4, DBS-2-217C) are shown in blue, pure TLR7 agonists (C4, EY-2-40, CL307) are shown in maroon, dual TLR7/8 agonists are shown in red (IMDQ, Meta-amine, XG-2-136, Hybrid 2), and pure TLR8 agonists (KHP-3-126, MB-152, DS-877, MB-564, MB-569, A-5-epsilon) are shown in magenta.

Figure 2. TLR and NLR agonists upregulate genes associated primarily with three gene families. Global transcriptomal signatures in RNASeq data were analysed in an unbiased manner by comparing root mean square deviations of fold change (from control values) in expression of each of the 26,363 genes across the 23 test samples, in duplicate. For each TLR/NLR agonist examined, root mean square deviations in fold change over the entire transcriptome (26, 363 annotated genes) were calculated as n = 126,363(log2(fold change¯n)1)2. The three major gene families showing significant upregulation were CC chemokines (red), CXC chemokines (red), and interferons (blue). Other upregulated genes are shown in green.

Figure 2. TLR and NLR agonists upregulate genes associated primarily with three gene families. Global transcriptomal signatures in RNASeq data were analysed in an unbiased manner by comparing root mean square deviations of fold change (from control values) in expression of each of the 26,363 genes across the 23 test samples, in duplicate. For each TLR/NLR agonist examined, root mean square deviations in fold change over the entire transcriptome (26, 363 annotated genes) were calculated as ∑n = 126,363(log2(fold change¯n)−1)2. The three major gene families showing significant upregulation were CC chemokines (red), CXC chemokines (red), and interferons (blue). Other upregulated genes are shown in green.

Figure 3. Transcriptomal ‘signatures’ of innate immune stimulation in CC chemokines. A heat map of fold change (means of duplicate samples, EDGE test validated) indicated that many of the TLRs and NLRs upregulated the CC chemokines 1, 2, 3, 4, 7, 8, 17, 18, 20, and 23.

Figure 3. Transcriptomal ‘signatures’ of innate immune stimulation in CC chemokines. A heat map of fold change (means of duplicate samples, EDGE test validated) indicated that many of the TLRs and NLRs upregulated the CC chemokines 1, 2, 3, 4, 7, 8, 17, 18, 20, and 23.

Figure 4. Discrimination between extracellular and intracellular innate immune receptors by CXC chemokine profiles. The extracellular TLRs 2, 4, and 5 showed strong upregulation of CXCL5, CXCL6 and CXCL8, while the endolyososomal TLRs 3, 7, and 8 were characterized by upregulation of CXCL11 and CXCL12. Heat maps of fold change (means of duplicate samples, EDGE test validated) are shown.
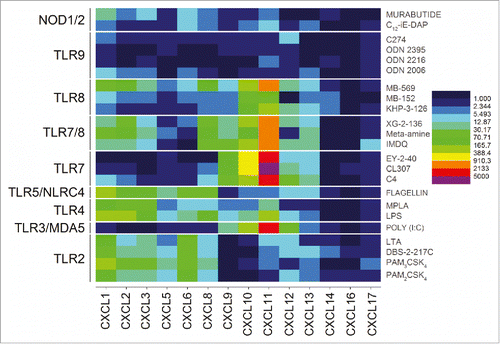
Figure 4. Discrimination between extracellular and intracellular innate immune receptors by CXC chemokine profiles. The extracellular TLRs 2, 4, and 5 showed strong upregulation of CXCL5, CXCL6 and CXCL8, while the endolyososomal TLRs 3, 7, and 8 were characterized by upregulation of CXCL11 and CXCL12. Heat maps of fold change (means of duplicate samples, EDGE test validated) are shown.

Figure 5. TLR7 upregulation of IFN-α and IFN-ω. Pure TLR7 and dual TLR7/8 agonists dramatically upregulated all IFN-α genes and IFN-ω. Heat maps of fold change (means of duplicate samples, EDGE test validated) are shown.

Figure 5. TLR7 upregulation of IFN-α and IFN-ω. Pure TLR7 and dual TLR7/8 agonists dramatically upregulated all IFN-α genes and IFN-ω. Heat maps of fold change (means of duplicate samples, EDGE test validated) are shown.

Figure 6. Validation of chemokine induction in TLR2 stimulated PBMCs. Human PBMCs were stimulated with TLR2 agonists for 16 h, and examined for CCL20 and CXCL6 expression by ELISA. PBMCs responded to both agonists that signal through TLR1/2 heterodimers (PAM3CSK4) and TLR2/6 heterodimers (PAM2CSK4 and DBS-2-217C). Means and standard deviations of triplicate samples are shown.
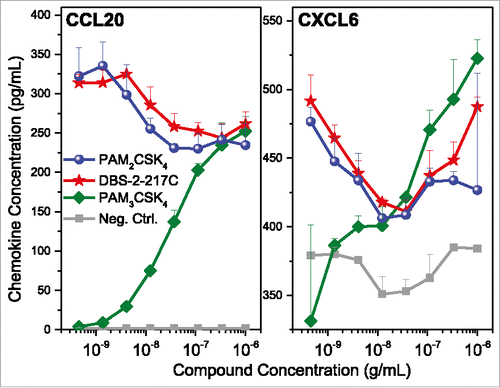
Figure 6. Validation of chemokine induction in TLR2 stimulated PBMCs. Human PBMCs were stimulated with TLR2 agonists for 16 h, and examined for CCL20 and CXCL6 expression by ELISA. PBMCs responded to both agonists that signal through TLR1/2 heterodimers (PAM3CSK4) and TLR2/6 heterodimers (PAM2CSK4 and DBS-2-217C). Means and standard deviations of triplicate samples are shown.

Figure 7. TLR2 agonists induce chemokine expression in skeletal muscle cells and human foreskin fibroblasts, but not dermal microvascular endothelial cells. Human skeletal muscle (SkMC), human foreskin fibroblast (HFF), and dermal microvascular endothelial (HMEC-1) cell lines were stimulated with TLR2 agonists and quantified for CCL20 and CXCL6 induction by ELISA. TLR2/6 agonists (PAM2CSK4 and DBS-2-217C) induced CCL20 and CXCL6 expression in both SkMCs and HFFs, but not HMEC-1 cells. None of the cell lines responded to the TLR1/2 agonist PAM3CSK4. Chemokine release assays were performed on triplicate samples. Means and standard deviations are shown.

Figure 7. TLR2 agonists induce chemokine expression in skeletal muscle cells and human foreskin fibroblasts, but not dermal microvascular endothelial cells. Human skeletal muscle (SkMC), human foreskin fibroblast (HFF), and dermal microvascular endothelial (HMEC-1) cell lines were stimulated with TLR2 agonists and quantified for CCL20 and CXCL6 induction by ELISA. TLR2/6 agonists (PAM2CSK4 and DBS-2-217C) induced CCL20 and CXCL6 expression in both SkMCs and HFFs, but not HMEC-1 cells. None of the cell lines responded to the TLR1/2 agonist PAM3CSK4. Chemokine release assays were performed on triplicate samples. Means and standard deviations are shown.

Figure 8. TLR2 and TLR6 are expressed in human foreskin fibroblasts. HFFs were interrogated for the expression of TLRs 1, 2, and 6 using confocal immunofluorescence with tyramide signal amplification. HFFs showed strong expression of TLR2 and TLR6, and very weak expression of TLR1. Samples were examined in triplicate; representative data are shown.

Figure 8. TLR2 and TLR6 are expressed in human foreskin fibroblasts. HFFs were interrogated for the expression of TLRs 1, 2, and 6 using confocal immunofluorescence with tyramide signal amplification. HFFs showed strong expression of TLR2 and TLR6, and very weak expression of TLR1. Samples were examined in triplicate; representative data are shown.

Figure 9. Chemotaxis of PBMCs toward TLR2/6- stimulated human foreskin fibroblasts. HFFs stimulated with TLR2/6, but not TLR1/2 agonists elicited functional chemotactic responses from lymphocytic populations in human PBMCs. Resting, adherent fibroblasts were stimulated with graded concentrations of agonists for 24 h in a chemotaxis plate. Chemotaxis of freshly isolated PBMCs was quantified by flow cytometry using lineage-specific antibodies. Means and SD on triplicate samples are shown.

Figure 9. Chemotaxis of PBMCs toward TLR2/6- stimulated human foreskin fibroblasts. HFFs stimulated with TLR2/6, but not TLR1/2 agonists elicited functional chemotactic responses from lymphocytic populations in human PBMCs. Resting, adherent fibroblasts were stimulated with graded concentrations of agonists for 24 h in a chemotaxis plate. Chemotaxis of freshly isolated PBMCs was quantified by flow cytometry using lineage-specific antibodies. Means and SD on triplicate samples are shown.