Figures & data
Figure 1. Geometric mean titer of antibodies at various time points after the vaccination from day 0 through month 12. Error bars indicate 95% Confidence intervals (CI). The data of GMTs from day 0 to 56 have been showed in the initial study.Citation20
![Figure 1. Geometric mean titer of antibodies at various time points after the vaccination from day 0 through month 12. Error bars indicate 95% Confidence intervals (CI). The data of GMTs from day 0 to 56 have been showed in the initial study.Citation20](/cms/asset/1a5a82e2-3124-407c-99d3-46f20c25118a/khvi_a_1486154_f0001_b.gif)
Figure 2. Accumulation curve of antibodies after vaccination at month 6 and 12. Figure A: Accumulation curve of antibodies to anti-F1 after vaccination in 15 and 30 groups at month 6 and 12. Figure B: Accumulation curve of antibodies to anti-rV after vaccination in 15 and 30 groups at month 6 and 12.
![Figure 2. Accumulation curve of antibodies after vaccination at month 6 and 12. Figure A: Accumulation curve of antibodies to anti-F1 after vaccination in 15 and 30 groups at month 6 and 12. Figure B: Accumulation curve of antibodies to anti-rV after vaccination in 15 and 30 groups at month 6 and 12.](/cms/asset/a7982c70-5a13-4158-97d4-ef7021068a2b/khvi_a_1486154_f0002_oc.jpg)
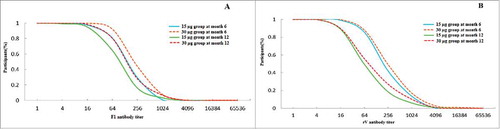
Table 1. Immunogenicity of antibodies to anti-F1 and anti-rV after vaccination at month 6 and 12.