Figures & data
Figure 1. Focus on the Patient section.
Figure 2. Flow diagram of the study participants. Footnote: N, number of participants; n, number of participants within the category; GCP, good clinical practice; TVC, total vaccinated cohort; ATP, according-to-protocol.
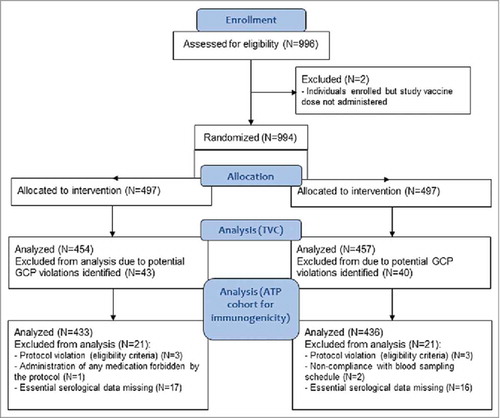
Table 1. Demographic characteristics of the study participants (total vaccinated cohort, N = 911).
Table 2. Non-inferiority of MMR-RIT vaccine compared to MMR II in terms of anti-measles, anti-mumps and anti-rubella adjusted geometric mean antibody concentrations at Day 42 (ATP cohort for immunogenicity).
Table 3. Non-inferiority of MMR-RIT vaccine compared to MMR II in terms of anti-measles, anti-mumps and anti-rubella seroresponse rates at Day 42 (ATP cohort for immunogenicity).
Figure 3. Percentage of participants who achieved a 4-fold or greater increase in anti-measles, anti-mumps, or anti-rubella virus antibody concentrations at Day 42 (ATP cohort for immunogenicity). Footnote: N, number of participants with both pre- and post-vaccination available results; ATP, according-to-protocol.
For participants with a seronegative status at pre-vaccination, a 4-fold rise in antibody concentration is defined as 4 times the cut-off level of the assay. Cut-off levels for anti-measles, anti-mumps and anti-rubella virus antibody concentrations are 150 mIU/mL, 5 EU/mL and 4 IU/mL, respectively. The error bars represent the upper and lower limits of the two-sided 95% confidence intervals obtained using the Clopper Pearson method.
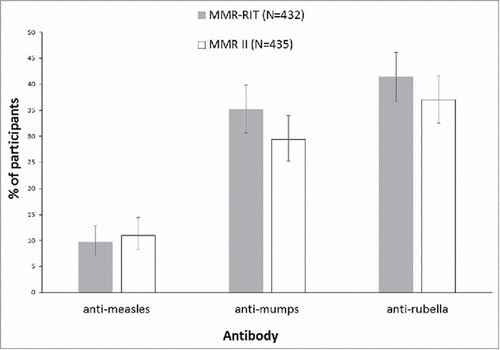
Figure 4. Incidence of solicited injection site (Day 0–3) and general adverse events (Day 0–42) (total vaccinated cohort). Footnote: N, number of participants with the documented dose with local symptoms sheets completed *Except for pain, redness, and swelling, for which MMR-RIT (N = 433). Fever: temperature ≥38°C. Grade 3 was defined as: limb was painful at rest, which prevented normal everyday activities (pain); diameter >50 mm (redness and swelling); temperature >39.5°C (fever); adverse event preventing normal, everyday activities (joint pain, rash/exanthem, meningism/seizure); swelling with accompanying general symptoms (parotid/salivary gland swelling). The error bars represent the upper and lower limits of the two-sided 95% confidence intervals obtained using the Clopper Pearson method.
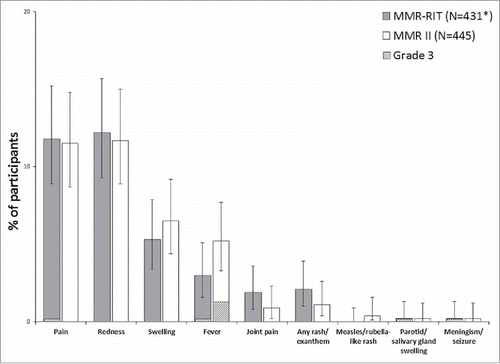
Table 4. Percentage of participants with unsolicited adverse events (Day 0–42) and serious adverse events (Day 0–180) (total vaccinated cohort).
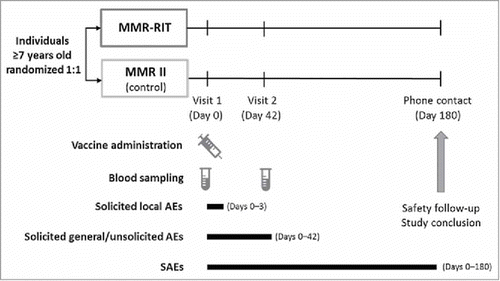
Figure 5. Study design. Footnote: AEs, adverse events; SAEs, serious adverse events.