
Figures & data
Figure 1. Youden index (YI) threshold method. (A) Probability distribution curves of overall baseline levels and postvaccination levels from RSV sF 20, 50, or 80 μg ± 2.5 µg GLA-SE plotted on the log-scale. The dashed line represents the YI threshold value for each biomarker. Threshold values and (baseline percentile) for MN IC50 titer = 739.2 (76%); anti-F IgG = 221.6 units/mL (91%); PCA = 20.7 µg/mL (96%), and ELISPOT = 42.2 SFC/106 PBMC (74%); (B) Percentage of subjects with postvaccination values greater than or equal to the threshold value for each assay or simultaneously for multiple assays. The values for all doses combined are used as a benchmark (white background), and percentages from individual doses are presented in red (lower than), white (equivalent to) and blue (higher than) all doses combined. Red and blue gradients represent the strength of the difference, with the darkest color representing the greatest difference. Ab, antibody; ELISPOT, enzyme-linked immunospot; GLA-SE, glucopyranosyl lipid adjuvant-stable emulsion; IgG, immunoglobulin G; MN, microneutralizing antibody; PBMC, peripheral blood mononuclear cells; PCA, palivizumab-competitive antibody; RSV, respiratory syncytial virus; sF, soluble fusion protein; SFC, spot-forming cells.
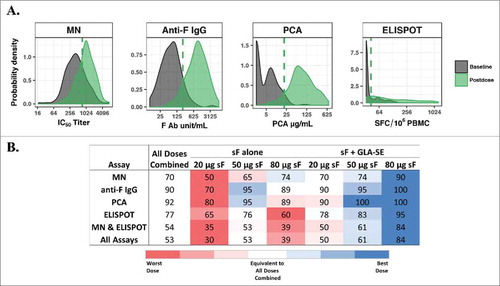
Figure 2. ROC-B method. (A) ROC curves for individual assays. The x-axis represents baseline percentiles and the y-axis is the probability that the postvaccination response was greater than or equal to the baseline percentile threshold. The ROC curve is shown for each formulation and combined arms of 20, 50, or 80 μg of RSV F protein ± GLA-SE; (B) Three-dimensional ROC surface plot for the combination of results from the MN and ELISPOT assays compared to baseline values from all arms combined. The x-axis and y-axis are baseline percentiles for ELISPOT and MN data, respectively, and the z-axis is the percentage of postvaccination values greater than or equal to both the MN and ELISPOT baseline percentile thresholds. The ROC surface is shown for each formulation and for the combination of all (20, 50, and 80 μg) dosage levels of sF combined ± 2.5 µg GLA-SE. The ROC surface for the all doses combined is shown in green and used as a benchmark, and the ROC surface for each individual formulation is shown in red, green and blue representing values on the z-axis lower than, equivalent to and higher than the benchmark ROC surface. ELISPOT, enzyme-linked immunospot; GLA-SE, glucopyranosyl lipid adjuvant-stable emulsion; IgG, immunoglobulin G; MN, microneutralizing antibody; PCA, palivizumab-competitive antibody; ROC, receiver-operating characteristic; ROC-B, receiver-operating characteristic relative to baseline; RSV, respiratory syncytial virus; sF, soluble fusion protein.
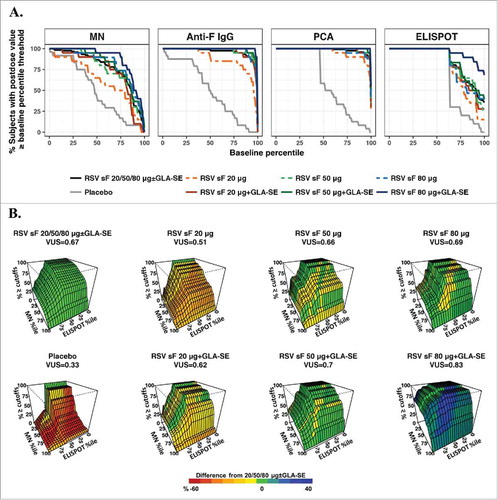
Figure 3. ROC-P method. (A) ROC curves for individual assays. The x-axis represents percentiles of the combined postdose values, and the y-axis is the percentage of postvaccination levels greater than or equal to the corresponding percentile threshold. The ROC curve is shown for each dose arm alone and for the combination of all vaccine formulations; (B) Three-dimensional ROC surface plot for the combination of results from the MN and ELISPOT assays compared to postdose values from all arms combined. The x-axis and y-axis are percentiles of the combined postdose distribution for ELISPOT and MN values, respectively, and the z-axis is the percentage of postvaccination responses greater to or equal than both the MN and ELISPOT thresholds. The ROC surface is shown for each formulation and for all formulations combined. The ROC surface for the all doses combined is shown in green and used as benchmark, and the ROC surface for each individual formulation is shown in red, green and blue representing values on the z-axis lower than, equivalent to and higher than the benchmark ROC surface. ELISPOT, enzyme-linked immunospot; GLA-SE, glucopyranosyl lipid adjuvant-stable emulsion; IgG, immunoglobulin G; MN, microneutralizing antibody; PCA, palivizumab-competitive antibody; ROC, receiver-operating characteristic; ROC-P, receiver-operating characteristic of postdose levels; VUS, volume under the surface.
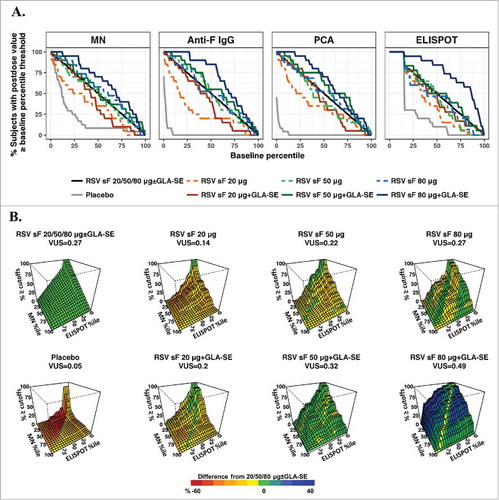
Table 1. Outline of the 3 methods.