Figures & data
Figure 1. Construction and characterization of MnFe2O4 NPs coated with CMX. (A) DLS results of citrate-coated MnFe2O4 NPs (Nano, upper panel) and citrate-coated MnFe2O4 NPs incubated with CMX (NCMX, lower panel). (B) TEM images of citrate-coated MnFe2O4 NPs. Characterization of CMX protein corona formation of Nano (C) and NCMX (D). (E) NCMX samples were separated by lateral magnetic separation and utilized for the dot plot. The first dot represents only citrate-coated Nano; the second dot represents only CMX as a positive control; the third dot represents magnetically separated citrate-coated Nano covered with CMX (NCMX); and the last dot is the residual protein in the supernatant after the adsorption of CMX onto the NPs (residual CMX). (F) Quantification of CMX adsorbed onto the NPs. NCMX was incubated with 10% SDS and then centrifuged, and the supernatant left was used for western blotting and comparison with a known concentration of CMX.
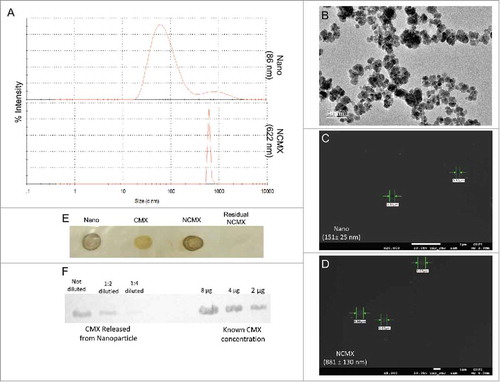
Figure 2. Immune response to subcutaneous vaccination is not affected by the NP dose in the formulation. Groups of four mice were immunized SC two times with 100 μL of NCMX, and the third booster was administered via intranasal instillation. Twenty-one days after the last immunization, the spleen and lungs were collected and analyzed by flow cytometry for Th1, Th17, and Tc1 lymphocytes (A).-one days after the last immunization, the spleen and lungs were collected and analyzed by flow cytometry for Th1, Th17, and Tc1 lymphocytes (A). The number of Th1 (CD4+IFN-γ+), Th17 (CD4+IL-17+), and Tc1 (CD8+IFN-γ+) cells in the spleen (B, D and F, respectively) and lungs (C, E and G, respectively) are shown. Differences between the means of the groups were determined by ANOVA and post-hoc test, and p values are shown. Serum samples were collected, and the humoral immune response was evaluated by measuring the levels of IgG1 (H) and IgG2a (I). Differences between the means of the groups were determined by ANOVA and significant differences with p < 0.05 are shown with an asterisk (*).
Figure 3. Subcutaneous immunization induces an increase in LECs (gp38+CD31+) in draining lymph nodes. Representative dot plots for each group are shown above the graphs of lymph node endothelial cell counts evaluated based on CD31, gp38 and CD21/35 staining 1 day (left graph) or 4 days (right graph) after immunization with CMX or Nano only or with the NCMX formulation. Differences among groups were determined by one-way ANOVA, and p values are shown. Significant differences were found among the groups, n = 4 mice.
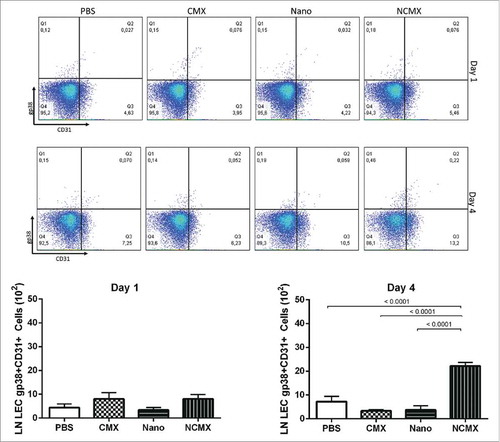
Figure 4. Mixed vaccination induces weak lung Th1 and splenic Th1 and Tc1 responses. Mice were immunized SC two times with 100 µL of NCMX, and the third booster was administered via intranasal instillation. Twenty-one days after the last immunization, the spleen and lungs were collected and analyzed by flow cytometry for Th1, Th17, and Tc1 lymphocytes (A). The number of Th1 (CD4+IFN-γ+), Th17 (CD4+IL-17+), and Tc1 (CD8+IFN-γ+) cells in the spleen (B, D and F, respectively) and lungs (C, E and G, respectively) are shown. Serum samples were collected, and the humoral immune response was evaluated by measuring the levels of IgG1 (H) and IgG2a (I). Differences between the means of the groups were determined by Student's t-test, and p values are shown. Significant differences were found between the groups, n = 4.
Figure 5. Intranasal vaccination increases the cellular immune response in the mucosa. (A) Mice were vaccinated 2 times at 21-day intervals with NCMX. At 21 days after the last immunization, the lungs were collected and analyzed by flow cytometry for (B) Th1 (CD4+IFN-γ+), (C) Th17 (CD4+IL-17+), and (D) Tc1 (CD8+IFN-γ+) cells. Mouse serum samples were collected 21 days after each vaccination for evaluation of the elicited humoral immune response by measuring the levels of IgG1 (E) and IgG2a (F). Differences between the means of the groups were determined by Student's t-test, and p values are shown. Significant differences were found between the groups, n = 4.
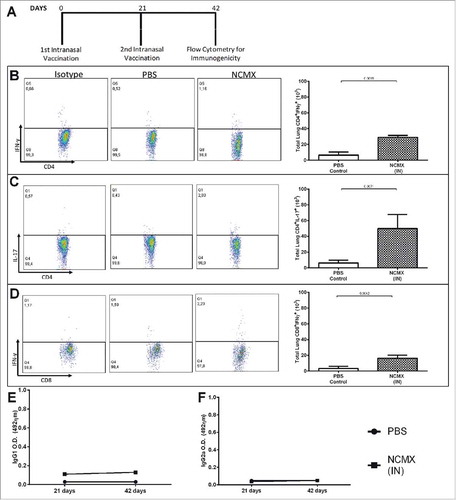
Figure 6. Evaluation of lung injury or tissue changes in intranasally vaccinated mice. Mice were vaccinated 2 times at 21-day intervals with NCMX. At 21 days after the last immunization, the lungs were collected, stained with H&E and analyzed for damage at 4x magnification (upper) and 40x magnification (botton).
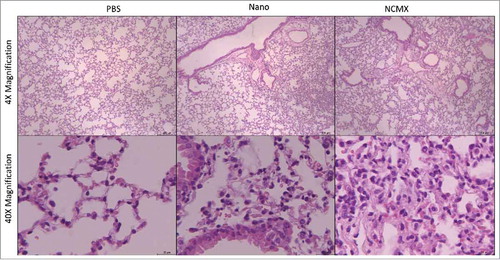
Figure 7. Challenge with Mtb after vaccination with NCMX recalls Th1 and Tc1 populations to the lungs. Thirty days after the challenge (A), the lungs were analyzed for the presence of CD4+IFN-γ+ (B) and CD8+IFN-γ+ (C) lymphocytes to evaluate the capacity of the immune cells generated by the vaccination to migrate to the lungs and to help protect against infection. The total number of cells was then calculated and is summarized in the graph below the dot plot for CD4+IFN-γ+ (D) and CD8+IFN-γ+ (E) cells. Differences among the groups were determined by one-way ANOVA, and p values are shown. Significant differences were found among the groups, n = 4.
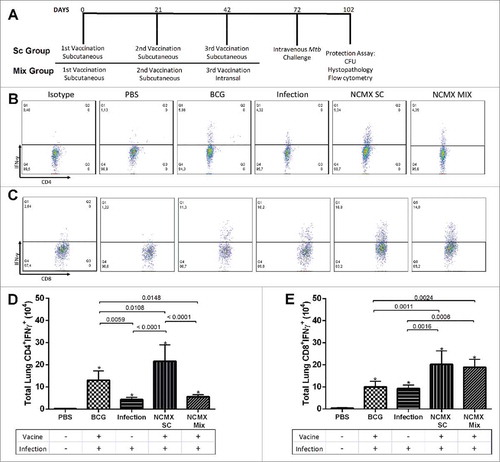
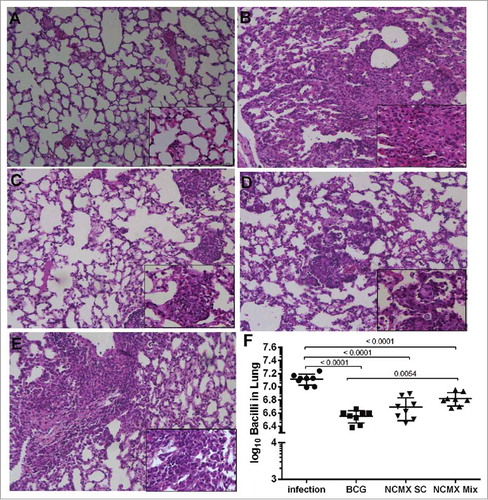
Figure 8. Vaccination with NCMX reduced the histopathological damage and bacterial load in the lungs of Mtb-challenged mice. Thirty days after the last vaccination via subcutaneous and mixed administration, mice were challenged with 106 CFU per animal. After thirty days, the mice were euthanized, and the lungs were studied to determine the capacity of the vaccination to protect against damage and pathological response (A to E), as well as its capacity to diminish the bacterial load in the lungs (F). Lung samples were also stained with H&E and analyzed for damage at 4x magnification and 40x magnification. Differences among the mean CFU values were determined by one-way ANOVA, and p values are shown. Significant differences were demonstrated among the groups, n = 8.