
Figures & data
Table 1. Efficacy of SLIT during therapy and three-year observation in comparison to placebo.
Table 2. Decrease in the TRS score during observation.
Figure 1. Decrease in phleum pratense IgE levels compared in placebo during three years of immunotherapy (I-III and three years of follow up(1-3).
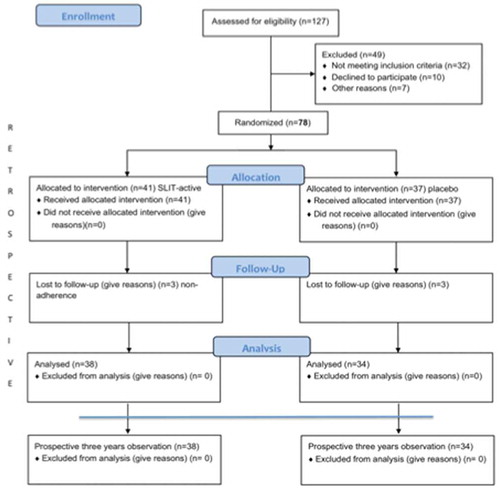
Figure 2. Increase in phleum pratense IgG4 during three years of immunotherapy (I-III and three years of follow up(1-3).
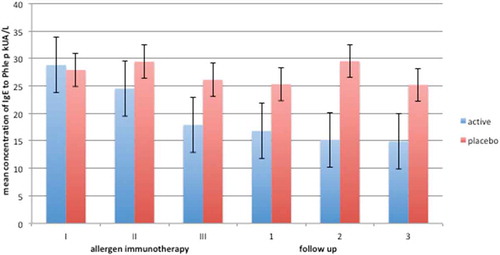
Figure 3. Number of participants assessed for eligibility that completed the study.
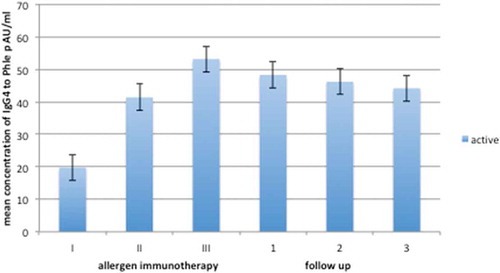
Table 3. Characteristics of the patients who completed follow-up.