
Figures & data
Table 1. Year of DHS survey and socio-economic characteristics of 27 study countries in sub-Saharan Africa.
Table 2. No of cases and percentages of symptoms of acute respiratory infections and episodes of diarrhoea among the children with respect to DTP3 vaccination in 27 countries in sub-Saharan Africa.
Table 3. No of cases and percentages of symptoms of acute respiratory infections and episodes of diarrhoea among the children with uptake of DTP3 and maternal HIV status in 27 countries in sub-Saharan Africa.
Figure 1. Forest plot showing the prevalence of estimates of symptoms of acute respiratory infections among the children with respect to DTP3 vaccination in 27 sub-Saharan Africa countries.
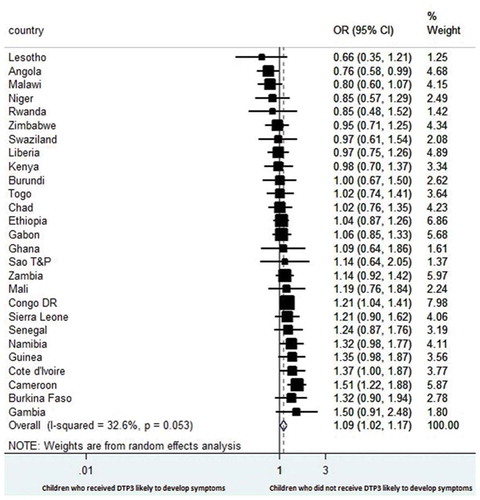
Figure 2. Forest plot showing the prevalence of estimates of episodes of diarrhoea among the children with respect to DTP3 vaccination in 27 sub-Saharan Africa countries.
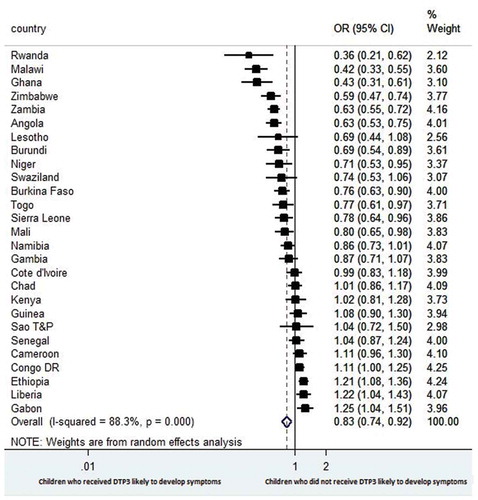
Figure 3. Forest plot showing the prevalence of estimates of symptoms of acute respiratory infections among the children of HIV-infected mothers with respect to DTP3 vaccination in selected sub-Saharan Africa countries.
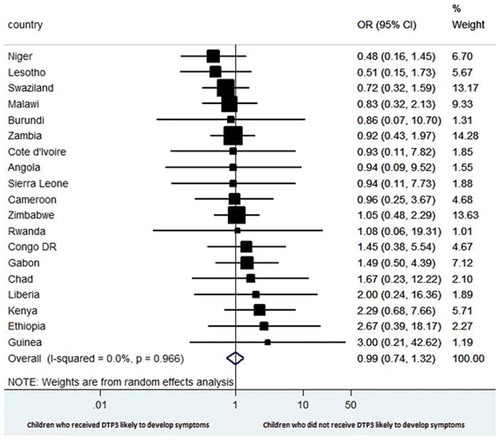
Figure 4. Forest plot showing the prevalence of estimates of episodes of diarrhoea among the children of HIV-infected mothers with respect to DTP3 vaccination in selected sub-Saharan Africa countries.
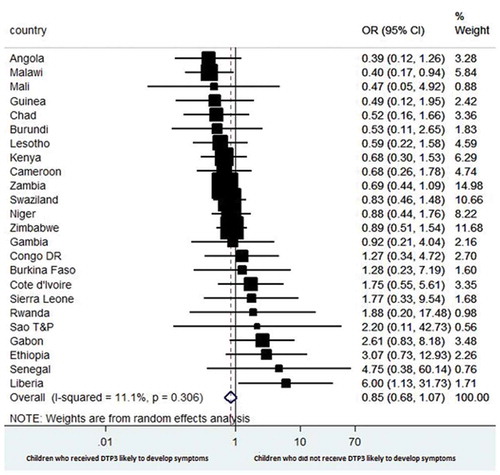
Figure 5. Forest plot showing theprevalence of estimates of symptoms of acute respiratory infections among the children who were vaccinated with DTP3 with respect to the maternal HIV status in 27 sub-Saharan Africa countries.
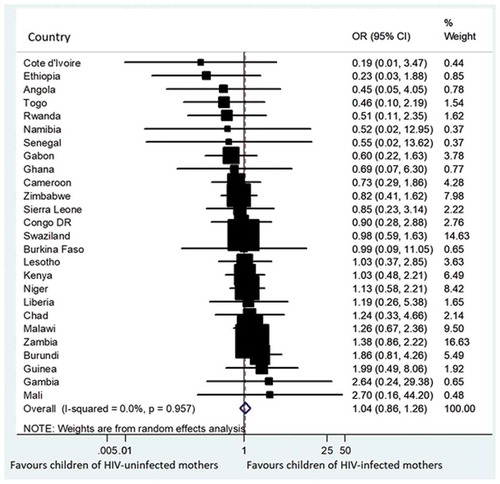
Figure 6. Forest plot showing the prevalence of estimates of episodes of diarrhoea among the children who were vaccinated with DTP3 with respect to the maternal HIV status in 26 sub-Saharan Africa countries.
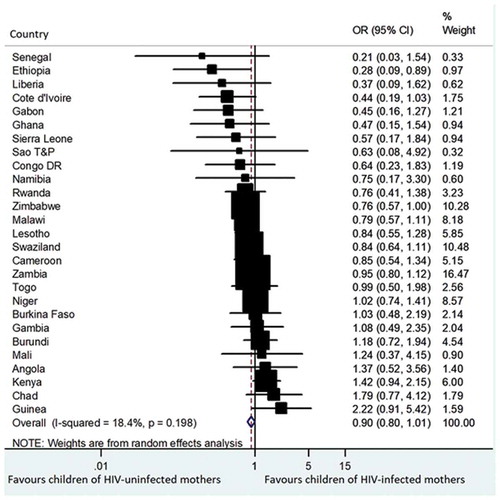
Figure 7. A plot showing the influence of each country on the overall pooled result for estimates of acute respiratory infections using “leave-one-country-out” sensitivity analysis.
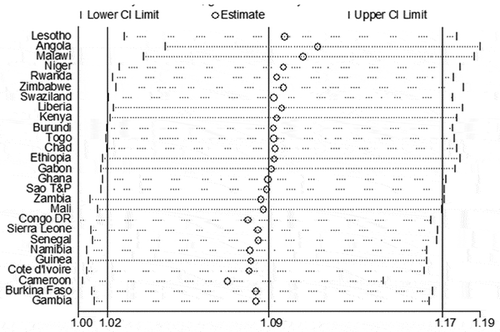
Figure 8. A plot showing the influence of each country on the overall pooled result for estimates of diarrhoea using “leave-one-country-out” sensitivity analysis.
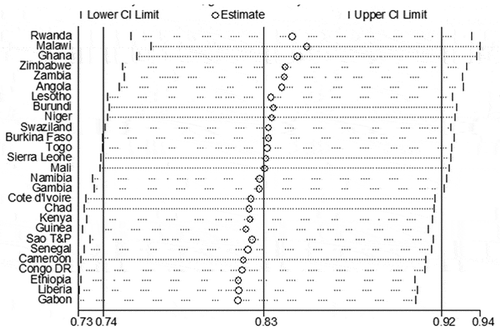
Table 4. Subgroup analysis and univariate meta-regression analysis results (for diarrhoea).