Figures & data
Figure 1. Expression of the recombinant TSA-1 in E. coli BL21 (DE3).
A fermenter containing 10L 2xYT medium (supplemented with kanamycin 50 µg/mL) was inoculated with E. coli BL21 (DE3)/pET41TSA1. When the optical density (OD600) reached 0.6, the expression of the recombinant protein was induced with 1 mM IPTG (USB) at 30°C maintaining the OD at 30% saturation. A) SDS-PAGE analysis of the induction of rTSA-1 in a batch fermentation. Total cell extract before and after the addition of 1 mM IPTG (2-18h) and without IPTG (N). Molecular marker (M). B) The rTSA-1 expressed as inclusion bodies was purified under denaturing conditions by Ni2+ Affinity chromatography. SDS-PAGE analysis of the total cell extract (lane 1), solubilized inclusion bodies (lane 2) and purified rTSA-1 (lane 3).
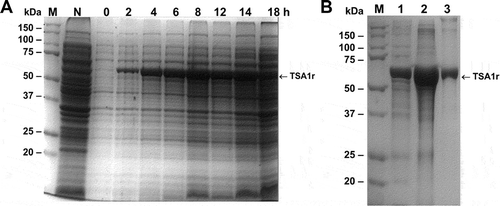
Figure 2. Chromatographic refolding of rTSA-1.
Chromatographic profile of the refolding of rTSA-1 by SEC using 82 mL (A) or 475 mL (C) volume (Column Volume) of Sepharose 6FF (GE Healthcare, UK) packed into a 1.5 x 50 cm or 2.6 X 100 cm columns respectively. Fractions were collected and pooled in (a), (b) and (c) samples, and analyzed by SDS-PAGE under non-reducing condition; 82 mL column (B) and 475 mL column (D). Molecular marker (M), samples (a), (b) (c). See Materials and methods for details.
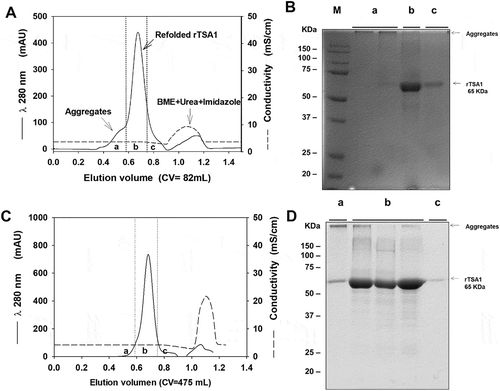
Figure 3. Consecutive chromatographic refolding batches of rTSA-1.
Chromatographic profile of ten consecutive SEC refolding batches of denatured rTSA-1 using a 82 mL volume (Column Volume) of Sepharose 6FF (GE Healthcare, UK) packed into a 1.5 x 50 cm. Absorbance at 280 nm (solid lane) and 0 to 8 M urea gradient (dashed lane). See Materials and methods for details.
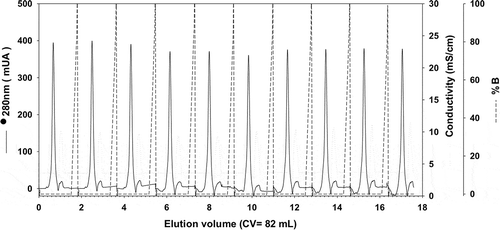
Figure 4. Effect of therapeutic vaccination on parasitemia of T. cruzi infected mice.
Balb/c mice were infected with T. cruzi, and treated at days 7 and 14 post-infection with the indicated vaccines (N = 7 mice per group). Control mice received saline solution. Parasitemia was measured over time (A), and overall parasitemia was estimated as the area under the curve (B) in arbitrary units. There was a significant difference among groups (ANOVA F = 4.01, P = 0.01), and * and ** indicate a significant differences with the saline group as determined by post-hoc Dunn’s test (P < 0.05 and P < 0.01, respectively). The experiment was performed twice.
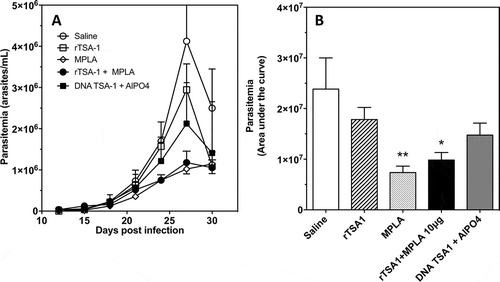
Figure 5. Effect of therapeutic vaccination on cardiac tissue inflammation and parasite burden in T. cruzi infected mice.
Mice were sacrificed at day 50 post-infection (N = 7 mice per group) and cardiac biopsies were processed for histopathologic analysis (A) and measurement of parasite burden (B). Micrographs of tissue sections were stained with hematoxylin and eosin, and inflammatory cell density was determined by image analysis using Multispec. There were significant differences in inflammatory cell density among groups (Kruskal-Wallis, P = 0.036). Cardiac parasite burden was measured by qPCR, and showed significant differences among groups (Kruskal-Wallis, P = 0.031). * indicates a significant difference with the saline group (Dunn’s test, P < 0.05). The experiment was performed twice.
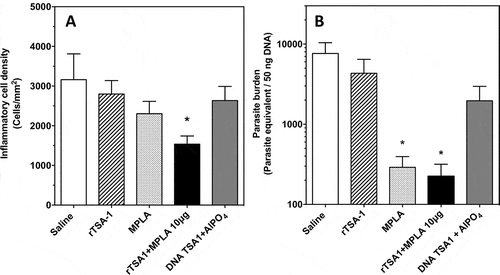
Figure 6. Effect of rTSA-1 formulation on therapeutic vaccine control of parasitemia.
rTSA-1 antigen was formulated with MPLA at different doses (A), or with E6020 (B) or GLA-SE (C) as adjuvants, and infected mice were treated with two doses of vaccine at days 7 and 14 post-infection (N = 4 to 7 mice per group). Parasitemia was measured to assess vaccine efficacy in controlling infection. (A) Formulation with MPLA at 10 µg/dose was the best formulation compared to MPLA at 5 µg and 15 µg (ANOVA, F = 2.67, P = 0.04). (B) Formulation of rTSA-1 with E6020 and E6020 alone also allowed to control parasitemia (ANOVA, F = 10.26, P < 0.001). (C) Similarly, formulation of rTSA1 with GLA-SE and GLA-SE alone significantly reduced parasitemia (ANOVA, F = 4.89, P = 0.009). * indicates a significant differences with the saline group as determined by post-hoc Dunn’s test (P < 0.05).
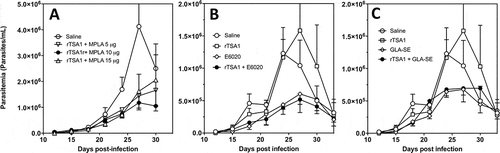
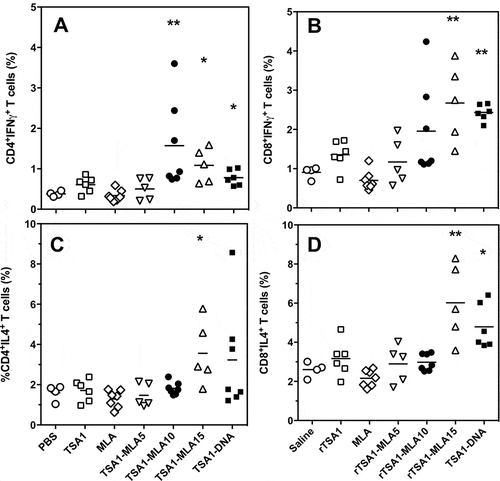
Figure 7. Effect of vaccine formulation on T cell phenotype.
T. cruzi-infected mice were treated with the indicated vaccine formulations, including saline solution, rTSA-1, MPLA, combinations of rTSA-1+ MPLA at doses of 5, 10 and 15 µg, and TSA-1 DNA (N = 4 to 7 mice per group). Splenocytes were harvested at 50 days post-infection, and stimulated in vitro with rTSA-1. Antigen-specific CD4+ (A and C) and CD8+ (B and D) T cells were analyzed for their production of IFNγ (A and B) and IL-4 (C and D) cytokines. Vaccine treatment resulted in significant differences in IFNγ-producing CD4+ (Kruskal-Wallis = 25.24, P < 0.001) and CD8 + T cells (Kruskal-Wallis = 25.96, P < 0.001), as well as in IL-4-producing CD4+ (Kruskal-Wallis = 13.51, P < 0.035) and CD8 + T cells (Kruskal-Wallis = 25.86, P < 0.001). * and ** indicate a significant difference with the saline control group (Dunn’s post-hoc test, P < 0.05 and P < 0.01, respectively).