
Figures & data
Table 1. Percentages of correct answers pre-intervention.
Figure 1. Differences among the percentages of correct answers pre- and post- intervention to three questions in the three different groups.
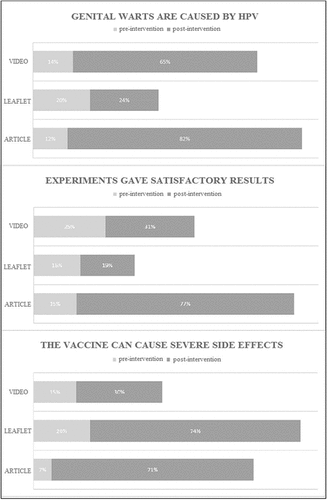
Table 2. Differences among the percentages of correct answers pre- and post- intervention to three questions in the three different groups.
Table 3. Answers to the question “In the material I found that” (%) in the three different groups.
Table 4. Multivariate results on usefulness of materials.
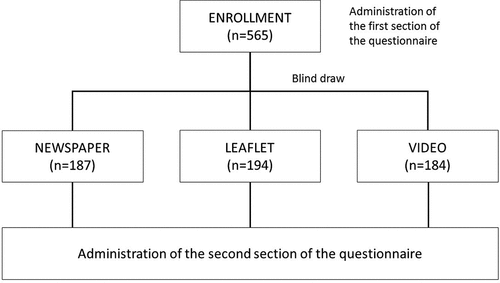
Figure 2. Randomization of the enrolled population.
Supplemental material