
Figures & data
Figure 1. Subject disposition.
PCV13 = 13-valent pneumococcal conjugate vaccine; QIV = quadrivalent inactivated influenza vaccine. *1 subject reported colitis 19 days after vaccination 1 (not related to study vaccine); 1 subject experienced mild injection-site induration and pain (both vaccines) 1 day after vaccination 1, resolving after 31 days (related to study vaccines).
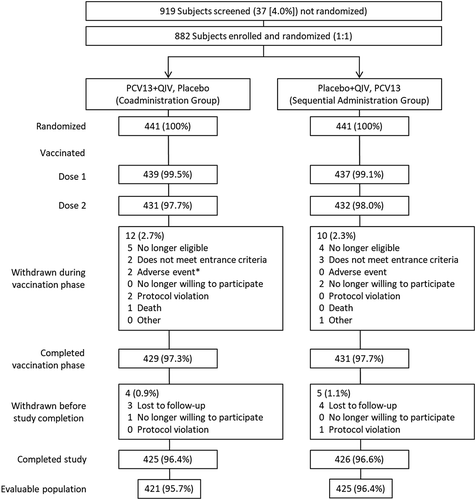
Table 1. Comparison of Pneumococcal OPA GMTs 1 Month After PCV13+ QIV vs 1 Month After PCV13 Alone (Evaluable Immunogenicity Population).
Figure 2. Pneumococcal OPA titer reverse cumulative distribution curves before and 1 month after PCV13 administration.
PCV13 = 13-valent pneumococcal conjugate vaccine; QIV = quadrivalent inactivated influenza vaccine. Reverse cumulative distribution curves displaying pneumococcal OPA titers for PCV13 serotypes before (solid lines) and after (dotted lines) PCV13 immunization are shown (evaluable immunogenicity population). Black line, PCV13+QIV/placebo; gray line, placebo+QIV/PCV13. Vertical line, OPA lower limit of quantitation titers for each serotype.
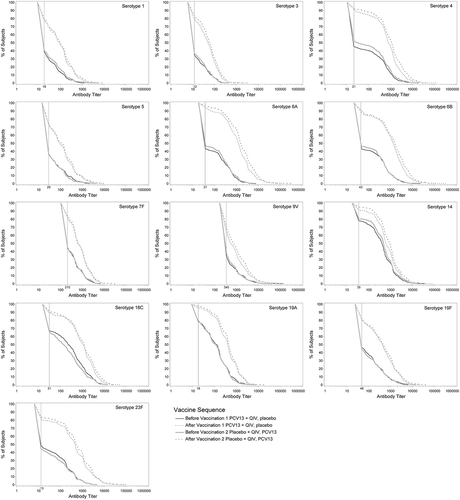
Table 2. Comparison of Influenza HAI GMTs 1 Month After PCV13+QIV vs Placebo+QIV (Evaluable Immunogenicity Population).
Table 3. Comparison of Seroconversion Rates of Influenza Strains Between PCV13+QIV and Placebo+QIV (Evaluable Immunogenicity Population).