Figures & data
Table 1. Demographics characteristics of children included in the study by rotavirus (RV) status
Table 2. Severity of acute gastroenteritis by rotavirus (RV) status and age group
Table 3. Severity of symptoms by rotavirus (RV) status
Table 4. Number of hospitalizations by rotavirus (RV) status and age group
Table 5. Estimated odd ratios and p-values of the fitted logistic regression model for the possible risk factors for hospitalization of acute gastroenteritis patients
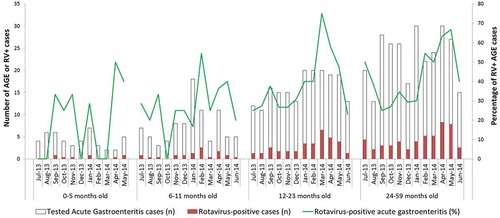
Figure 1. Seasonal distribution of acute gastroenteritis (AGE) cases and percentage of rotavirus-positive (RV+) cases by age group (months)