Figures & data
Table 1. Baseline characteristics.
Table 2. OPA GMTs among the 3 vaccine sequences 1 year after the second vaccination.
Table 3. Comparison of OPA GMTs 1 year after vaccination 2 in PPSV23-naive and PPSV23-preimmunized subjects.
Table 4. Comparison of OPA GMTs 1 year after vaccination 2 with 1 year after vaccination 1 in PPSV23-naive subjects (Study 1).
Table 5. Comparison of OPA GMTs 1 year after vaccination 2 with 1 year after vaccination 1 in PPSV23-preimmunized subjects (Study 2).
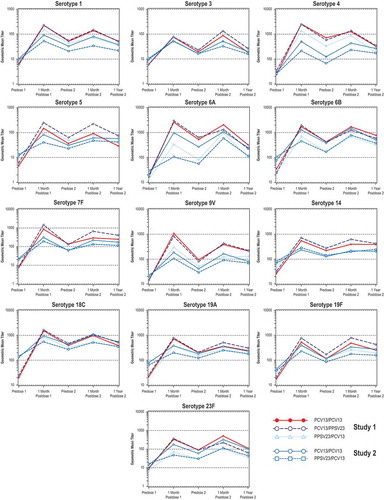
Figure 1. Serotype-specific OPA GMTs from all study time points from before the first vaccination through 1 year after the second vaccination. The first 3 points for each serotype correspond with data from study 1Citation10 and study 2.Citation11 Abbreviations: GMT = geometric mean titer; OPA = opsonophagocytic activity.