Figures & data
Figure 1. Tumor growth and tumor weight after HPV + PFPS + DCs early and late treatment.
After injection of TC-1 cells, tumor mice were immunized twice on days 5 and 12 in HPV + PFPS + DCs early and PFPS + DCs groups, or on days 12 and 19 in HPV + PFPS + DCs late group. (A) Tumor volumes (mean± SEM) were measured shown in the left panel. The area under curve (AUC) was calculated using Prism 5 and shown in right panel (mean± SEM). P value (Mann-Whitney test) is given. (B) Tumors were isolated and weighted at the end of this experiment. The tumor photo and weight (mean± SEM) are shown in upper and lower panels, respectively. *P < 0.05 and **P < 0.01 (ANOVA) compared to control group. #P < 0.05 and ##P < 0.01 (ANOVA) compared to PFPS + DCs group.
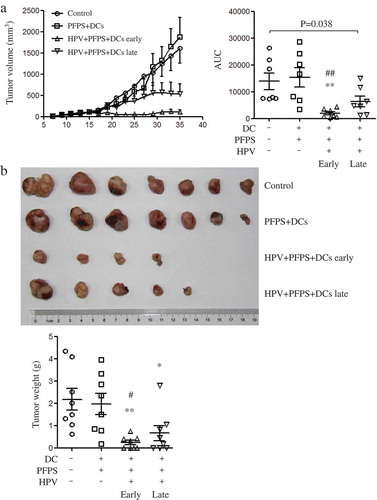
Figure 2. The frequencies of CD4+ and CD8+ T cells and their subsets in spleens of tumor mice.
Splenocytes were isolated from tumor mice at the end of this experiment to detect the frequencies (mean± SEM) of CD4+ (A) and CD8+ (B) T cells and their subsets by flow cytometry. The contour panels show the gating strategy. *P < 0.05 and **P < 0.01 (ANOVA) compared to control group. #P < 0.05, ##P < 0.01 and ###P < 0.001 (ANOVA) compared to PFPS + DCs group.
Figure 3. The correlation of CD4+ and CD8+ Tem cells with tumor volumes.
The nonparametric correlation was calculated by GraphPad Prism 5.
Figure 4. HPV-specific cellular responses and the frequencies of MDSCs and macrophages.
Splenocytes were isolated from tumor mice at the end of this experiment. (A) Splenocytes were stimulated with HPV-16 E6 and E7 peptides overnight. HPV-specific cellular responses were analyzed by flow cytometry. The representative dot plots are shown in upper panels and the summary data (mean± SEM) of HPV-specific CD4+ and CD8+ T cells are shown in lower panels. P values (Mann-Whitney test) are given. (B) The frequencies (mean± SEM) of MDSCs (CD11b+Gr-1+) and macrophages (CD11b+Gr-1−) in spleens of tumor mice were detected by flow cytometry. The contour panel shows the gating strategy. P value (Mann-Whitney test) is given. *p < 0.05 and **p < 0.01 (ANOVA) compared to control group. #P < 0.05, ##P < 0.01 and ###P < 0.001 (ANOVA) compared to PFPS + DCs group.
Figure 5. The correlation of CD8+IFN-γ+ T cells and MDSCs with tumor volumes.
The nonparametric correlation was calculated by GraphPad Prism 5
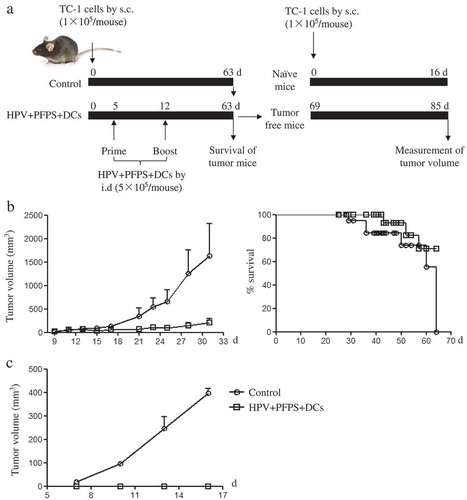
Figure 6. The survival of tumor mice and inhibition of tumor recurrence.
(A) The strategy of treatment. (B) The growth of tumors and survival of tumor mice. After HVP + PFPS+ DCs treatment, tumor volumes (mean± SEM) were measured and shown in left panel, the survival of tumor mice were monitored and shown in right panel. (C) The protective effect of HVP + PFPS+ DCs on tumor recurrences. 3 tumor free mice in HVP + PFPS + DCs group were re-challenged and 2 naïve mice were inoculated with TC-1 cells, then tumor growth was measured. The mean± SEM of tumor volumes was shown.