
Figures & data
Table 1. Disease events and deaths related to HPV types 6/11/16,718/31/33/45/52/58 prevented over a time horizon of 100 years.
Table 2. Additional reductions in the incidence and mortality rates of diseases related to HPV types 6/11/16/18/31/33/45/52/58 over a time horizon of 100 years.
Figure 1. Epidemiological impact of GNV vaccination strategies over a 100-year time horizon.
*Related to the HPV types included in the nonavalent vaccine (HPV types 6/11/16/18/31/33/45/52/58).
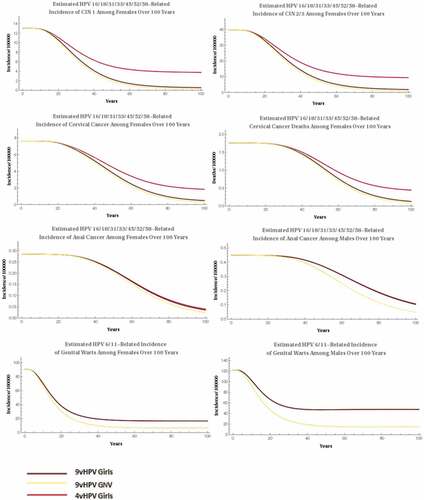
Table 3. Cost-effectiveness results in the base case analysis.
Figure 2. Tornado diagrams showing the ICERs obtained in the sensitivity analysis.
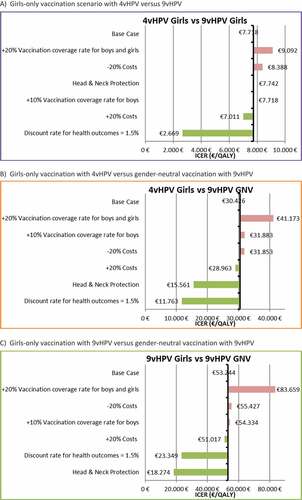
Table 4. Vaccine efficacy assumptions (International).
Table 5. Costs of diagnosing and treating diseases caused by HPV infection.
Table 6. Model calibration.*
Supplemental material