Figures & data
Figure 1. JE cases and deaths in India with case fatality rate and trendlines.
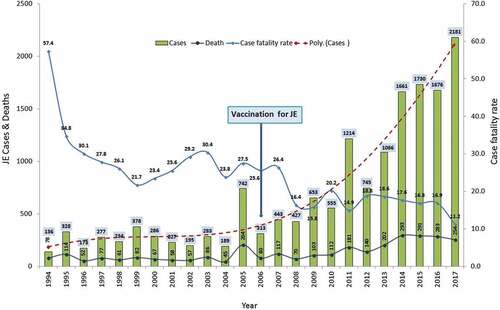
Figure 2. JE cases and deaths per million populations in India.
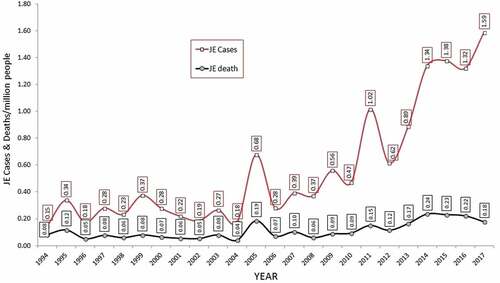
Figure 3. JE cases and deaths and their polynominal trendline in Tamil Nadu.
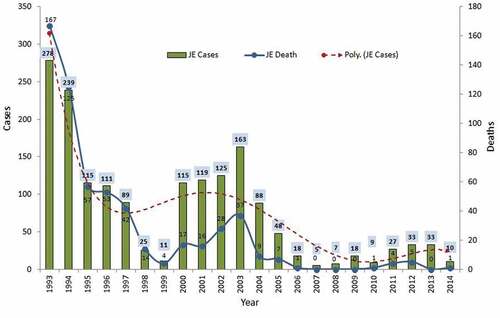
Figure 4. JE cases and deaths and their polynominal trendline in non-vaccinated districts of Tamil Nadu.
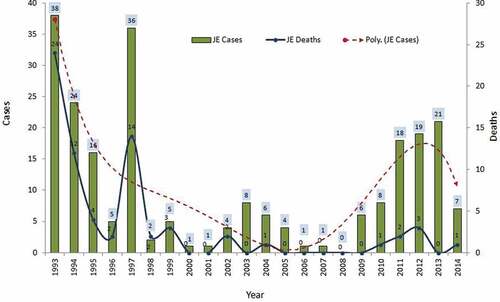
Figure 5. JE cases and deaths and their polynominal trendline in vaccinated districts of Tamil Nadu.
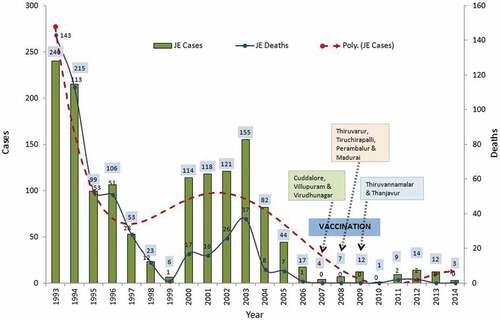
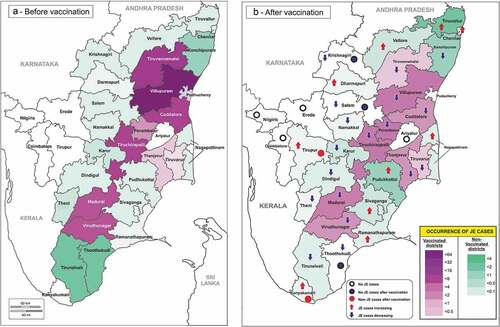
Figure 6. Occurrence of JE cases before and after SA 14-14-2 vaccination in Tamil Nadu, India. A. Before vaccination; B. After vaccination. Note the density of cases (violet) before and after vaccination in the first and second map respectively and declining of cases in all the vaccinated districts. In contrast, the density of cases (green) is increasing in many non vaccinated districts after the period of vaccination and in many districts new cases appeared and increasing.