
Figures & data
Table 1. Demographics of study population. Bolding indicates statistical significance.
Figure 1. Seroprevalence of HPV L1 antibodies by sex and HPV type, compared by logistic regression.
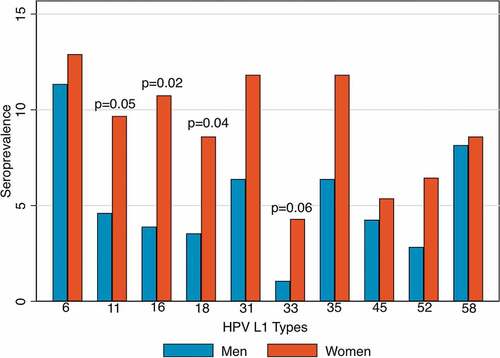
Table 2. Differences in behavior by sex and HPV16 and HPV18 L1 seroprevalence. Bolding indicates statistical significance. IQR, interquartile range.
Table 3. Logistic regression of HPV16 and HPV18 L1 seroprevalence on demographic factors and behavioral exposure. Bolding indicates statistical significance.