Figures & data
Figure 1. Relative importance of attributes.
The distribution of the individual relative importance across subjects is presented for each attribute, separately for each country. The individual estimates of the relative importance are derived from the Bayesian estimations of the part-worth utilities using a hierarchical multinomial logit model.
The limits of the boxes represent the 1st and 3rd quantiles and the bars in the middle represent the medians. The symbols within the boxes represent the means. The whiskers around the boxes extend up to 1.5 times the interquartile ranges. All extreme observations are shown using symbols beyond the whiskers.
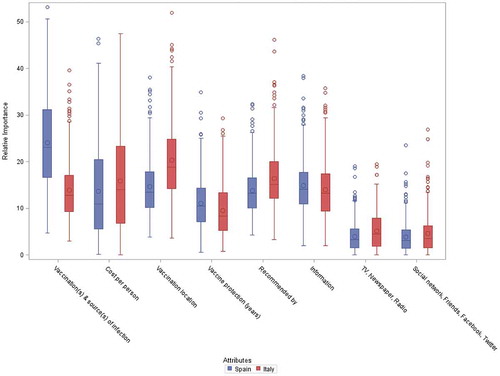
Table 1. Characteristics of participants who completed the final study questionnaire.
Figure 2. Relative utilities and utility differences in Spain.
Mean part-worth utilities are presented using a colored line connecting all levels for the same attribute. Bonferroni-adjusted p-values for the difference compared to the utility of the lowest level are presented close to each point.
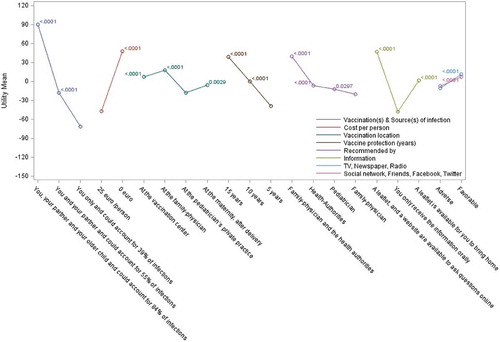
Table 2. Attributes and level of attributes used for the formal study questionnaire.
Table 3. Most ideal vaccination scenario selected by at least 3% of the Spanish and Italian participants.
Table 4. Participant’s subjective opinions on vaccine adoption under their most preferred scenario.
Figure 3. Relative utilities and utility differences in Italy.
Mean part-worth utilities are presented using a colored line connecting all levels for the same attribute. Bonferroni-adjusted p-values for the difference compared to the utility of the lowest level are presented close to each point.
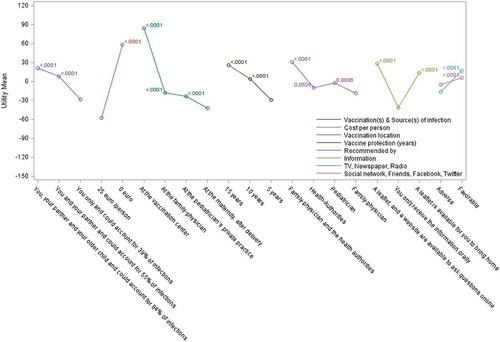
Figure 4. Probability of vaccine adoption.
) represents the respondent probability of vaccine adoption using logistic regression calibrated through a series of six vaccination scenarios. ) represents the proportion of respondents choosing possible likelihood of adoption level preferences. Probability of adoption is calculated considering the most ideal vaccination scenario for each subject assuming vaccination at zero cost (solid curve) and at a cost of 25€ per person (dashed curve) presented for both Spain and Italy. Probabilities are based upon the subjective opinions of the respondents on their likelihood of adoption under their ideal vaccination scenario. The ‘Definitely will not buy’ category included in Supplementary Table 5 is not presented graphically as the number of subjects contributing to that category was not sufficient to provide reliable estimates.
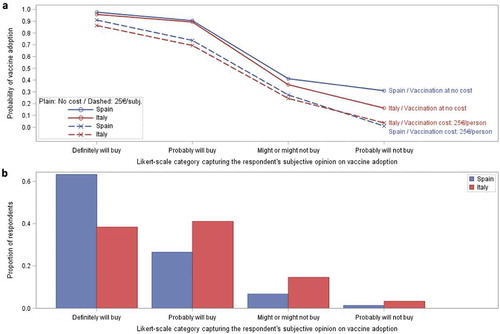
Figure 5. Focus on the patient section.