Figures & data
Table 1. Baseline immune status in the according-to-protocol cohorts and subsets.
Table 2. T- and B-cell assays.
Figure 1. DENV-specific CD4+ T-cell responses in Puerto Rican children. DENV-specific CD4+ T-cell responses in Puerto Rican children aged 1–12 years after immunization with the F17 or F19 vaccines are presented for the overall sample subset (a), and stratified by their DENV priming status at baseline (b). Blood samples were obtained prior to each vaccination (Day [D] 0 and month [M] 6), 3 months after the first dose (M3) and 1 month after the second dose (M7). Data are represented in box-and-whiskers plots as percentages of DENV-specific CD4+ T cells expressing (after in vitro stimulation) at least IL-2, IFN-γ or TNF-α among all CD4+ T cells, with medians, first and third quartiles, and minimum/maximum values presented.
![Figure 1. DENV-specific CD4+ T-cell responses in Puerto Rican children. DENV-specific CD4+ T-cell responses in Puerto Rican children aged 1–12 years after immunization with the F17 or F19 vaccines are presented for the overall sample subset (a), and stratified by their DENV priming status at baseline (b). Blood samples were obtained prior to each vaccination (Day [D] 0 and month [M] 6), 3 months after the first dose (M3) and 1 month after the second dose (M7). Data are represented in box-and-whiskers plots as percentages of DENV-specific CD4+ T cells expressing (after in vitro stimulation) at least IL-2, IFN-γ or TNF-α among all CD4+ T cells, with medians, first and third quartiles, and minimum/maximum values presented.](/cms/asset/a2e15c7d-578e-491f-a3b1-c9f9a7b87b81/khvi_a_1581536_f0001a_b.gif)
Figure 1. (Continued).
Figure 2. DENV-specific CD4+ T-cell responses in adults and/or adolescents in the US, Thailand and Puerto Rico. DENV-specific CD4+ T-cell responses after immunization with the F17 or F19 vaccines are presented for the overall sample subset of adults in the US and Thailand, and adolescents and adults in Puerto Rico (a), and for US subjects stratified by their DENV priming status at baseline, with numbers of evaluated subjects as indicated (b). Blood samples were obtained prior to each dose (Day [D] 0 and month [M] 6), 1 and 3 months after both the first dose (M1 and M3) and the second dose (M7 and M9). Data are presented in box-and-whiskers plots as percentages of DENV-specific CD4+ T cells expressing (after in vitro stimulation) at least two immune markers among IFN-γ, IL-2, TNF-α and CD40L of all CD4+ T cells, with medians, first and third quartiles, and minimum/maximum values presented.
![Figure 2. DENV-specific CD4+ T-cell responses in adults and/or adolescents in the US, Thailand and Puerto Rico. DENV-specific CD4+ T-cell responses after immunization with the F17 or F19 vaccines are presented for the overall sample subset of adults in the US and Thailand, and adolescents and adults in Puerto Rico (a), and for US subjects stratified by their DENV priming status at baseline, with numbers of evaluated subjects as indicated (b). Blood samples were obtained prior to each dose (Day [D] 0 and month [M] 6), 1 and 3 months after both the first dose (M1 and M3) and the second dose (M7 and M9). Data are presented in box-and-whiskers plots as percentages of DENV-specific CD4+ T cells expressing (after in vitro stimulation) at least two immune markers among IFN-γ, IL-2, TNF-α and CD40L of all CD4+ T cells, with medians, first and third quartiles, and minimum/maximum values presented.](/cms/asset/65c68eea-c12c-40fb-9882-adb04008ce2d/khvi_a_1581536_f0002a_b.gif)
Figure 2. (Continued).
Figure 3. DENV-specific T-cell responses in US adults (ICS with peptide pool stimulation). (a) Representative flow plots of IFN-γ vs TNF-α production by CD4+ T cells or CD8+ T cells (left-hand and right-hand panels, respectively) after stimulation of peripheral blood mononuclear cells with negative control or the DENV-2 nonstructural (NS) 3 peptide pool are shown. Cells co-expressing other functions (CD107a, IL-2, CD40L or MIP-1β) are highlighted in color. Data are from one representative subject at 1 month after the second dose (M7). (b) Magnitudes of responses of CD4+ T cells and CD8+ T cells (left-hand and right-hand panels, respectively) producing at least IFN-γ after stimulation with DENV-1 envelope (E), DENV-2 E, DENV-1 NS3, or DENV-2 NS3 peptide pools are presented for 13 vaccinated subjects. PBMC were obtained pre-vaccination (D0) and 1 month after the second dose (M7). Data are background (negative control value)-subtracted. For the subjects with a D0 value available, a response was considered positive if it was ≥0.05%, and the background-subtracted value at M7 was at least 3 times higher than the subject-matched value at day 0.
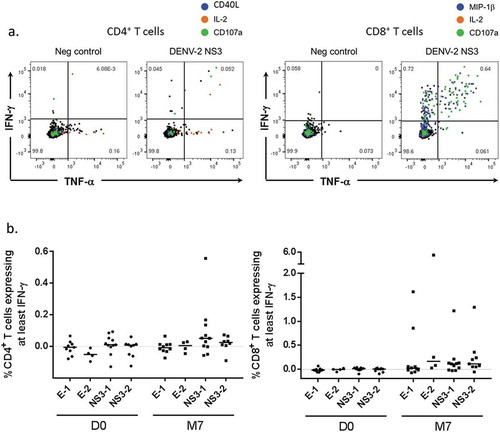
Figure 4. Specificity of T-cell responses in DENV-unprimed subjects. The magnitudes and specificity of background (medium)-subtracted T-cell responses to different DENV antigens measured at 1 month after the second dose (Month 7) by IFN-γ ELISPOT are presented. Samples were collected from a subset of US subjects (with subject numbers indicated) who were DENV-unprimed at baseline. Each bar represents the response of one subject. A response was considered positive if it was ≥55 spot-forming units (SFU) per 106 PBMC, and exceeded response to the negative control by four-fold. (a) Magnitudes of T-cell responses to individual DENV-2 antigens measured after stimulation with peptide pools covering DENV-2 nonstructural (NS) 1, NS2, NS3, NS4, NS5, capsid (C), premembrane (PrM) and envelope (E) proteins are presented. (b) Relative proportions of the T-cell response to DENV-1, DENV-2, DENV-3 and DENV-4 NS3 peptide pools were determined for the subjects with DENV-2 NS3 specific response in the analysis shown in (a).
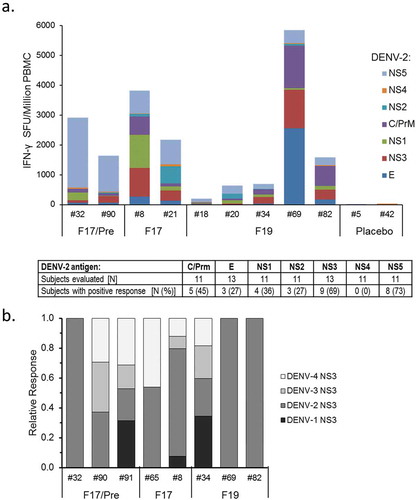
Figure 5. DENV-specific B-cell responses to tetravalent live-attenuated DENV vaccines in different study populations. (a) Frequencies of DENV-specific B-cells for the overall sample subsets of study populations in the US and Thailand (adults) and Puerto Rico (adults and adolescents) after immunization with F17 or F19 vaccine are presented. Blood samples were obtained prior to each dose (Day [D] 0 and month [M] 6), at 1 and 3 months after both the first dose (M1 and M3) and the second dose (M7 and M9). Box-and-whiskers plots represent the percentages of responding B cells with medians, first and third quartiles, and the minimum/maximum values measured. (b) B-cell responses in the Puerto Rican subjects after subtraction of the pre-vaccination responses by subject are presented. (c) B-cell responses in the US subjects stratified by their DENV priming status at baseline are presented, with numbers of evaluated subjects indicated (numbers may vary by time-point and serotype).
![Figure 5. DENV-specific B-cell responses to tetravalent live-attenuated DENV vaccines in different study populations. (a) Frequencies of DENV-specific B-cells for the overall sample subsets of study populations in the US and Thailand (adults) and Puerto Rico (adults and adolescents) after immunization with F17 or F19 vaccine are presented. Blood samples were obtained prior to each dose (Day [D] 0 and month [M] 6), at 1 and 3 months after both the first dose (M1 and M3) and the second dose (M7 and M9). Box-and-whiskers plots represent the percentages of responding B cells with medians, first and third quartiles, and the minimum/maximum values measured. (b) B-cell responses in the Puerto Rican subjects after subtraction of the pre-vaccination responses by subject are presented. (c) B-cell responses in the US subjects stratified by their DENV priming status at baseline are presented, with numbers of evaluated subjects indicated (numbers may vary by time-point and serotype).](/cms/asset/161b8633-3a24-4e7b-ad42-6ecdf7a6417b/khvi_a_1581536_f0005a_b.gif)
Figure 5. (Continued).
Figure 6. Correlations between memory B-cell responses and neutralizing antibody responses in Thai adults. Memory B-cell responses and DENV-specific neutralizing antibody responses observed in Thai adults are presented at pre-vaccination (pre), by the subjects’ baseline Japanese encephalitis virus (JEV) priming status (a), and at pre-vaccination, 1 month after the first (P1(M1)) and the second (PII(M7)) dose, by DENV serotype (b).
Figure 7. Focus on the patient section.