Figures & data
Table 1. Serious adverse events
Table 2. Febrile convulsions incidence and self-controlled case-series analysis
Table 3. Meningitis cases
Figure 1. Meningitis cases by time-to-onset after dose 1 and by treatment group.
R3R, group receiving 4 doses of RTS,S/AS01; R3C, group receiving 3 doses of RTS,S/AS01 plus 1 dose of control vaccine; C3C, group receiving 4 doses of control vaccine
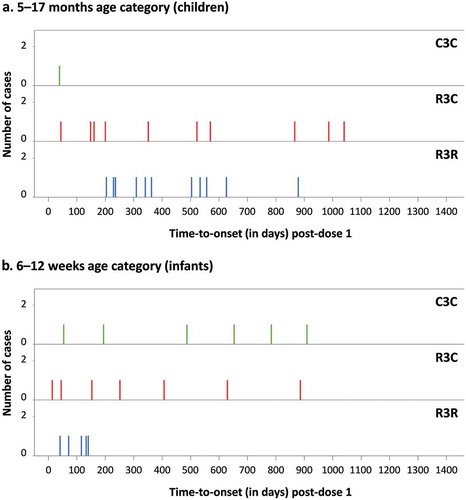
Figure 2. Distribution of meningitis cases by site and etiology in both age categories.
One case with viral etiology is included in the “No pathogen identified” category (R3R group)
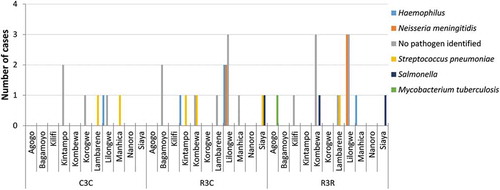
Table 4. Distribution of severe malaria manifestations
Figure 3. Cerebral malaria cases (identified per computer algorithm) by time-to-onset after dose 1 and by treatment group (5–17 months age category)
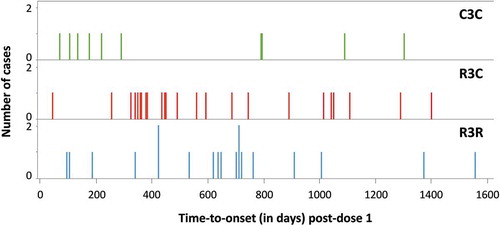
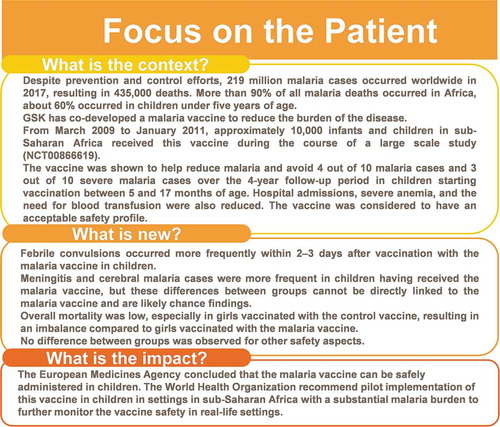
Figure 4. Focus on the patient summary of the findings