
Figures & data
Figure 1. All C. difficile infection cases and the crude annual incidence rates per 10,000 person-years for CPRD/HES (A) and PHE (B) n: number of cases, CPRD: Clinical Practice Research Datalink database, HES: Hospital Episode Statistics database, PHE: Public Health England database * 2012 contains data from 1st January – 31st of March only. The crude rate is based on estimated full year data (2012 figures were multiplied by 4 to make full year estimates)
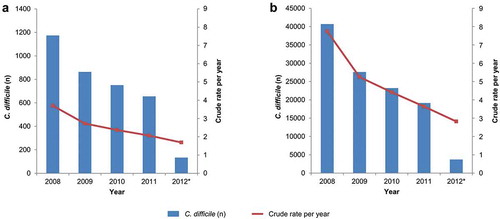
Table 1. Demographics for the CPRD/HES and CDC study populations
Figure 2. Receiver operating characteristic curve for varying risk scores for C. difficile infection within 90 days
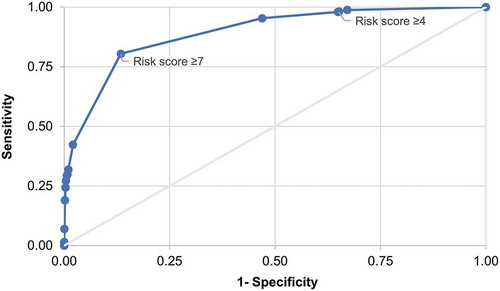
Table 2. Risk classification and C. difficile infection within 90 days or 365 days of index date with cut–off risk scores set to either 4 or 7 (sensitivity analysis)
Table 3. The study population by risk status and C. difficile infection status within 90 days of the index date
Table 4. Logistic regression for assessment of the association of risk factors assessed during the 90 days before C. difficile infection onset