
Figures & data
Figure 1. Flow diagram illustrating the identification of studies providing updated medical care cost estimates for HPV-associated cancers in the United States.
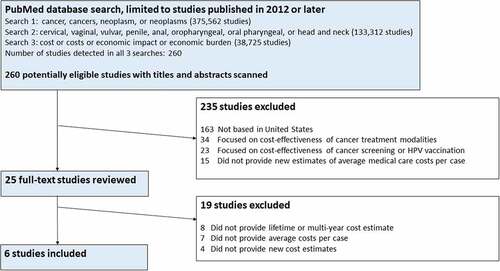
Table 1. Medical care costs for HPV-associated cancers in the United States: Estimates from recent studies (2012 to 2018), compared to previous studies (before 2012) commonly cited in cost-effectiveness analyses of HPV vaccination.
Table 2. Estimated vaccination costs, number of quality-adjusted life years (QALYs) gained, medical costs averted, and cost-effectiveness estimates for two HPV vaccination strategies in the United States, over a 100-year time horizon.
Table 3. Sensitivity analysis: Estimated cost per quality-adjusted life year ($ per QALY) gained when applying cancer cost estimates from recent studies (2012 to 2018) and from older studies (before 2012), when other model parameters are varied.