Figures & data
Table 1. Evaluated Staphylococcus aureus proteins
Figure 1. CD4+ T-cell activation by SA proteins. Background (medium)-subtracted SA-specific responses from healthy donor PBMCs cultured with controls or SA antigens are represented in terms of either the frequencies of proliferating cells in the CD4+ T cells (a), or the cytokine (IFN-γ, IL-17, TNF-α) production measured in culture supernatants (b). TT, tetanus toxoid (positive control). KWC, SA killed whole-cell antigen (positive control). TRAP, malaria thrombospondin-related anonymous protein (negative control). Each symbol in (a) represents one subject. Horizontal lines (a) and bars (b) represent medians calculated for the 14 to 16 donors included in each experiment
Figure 2. Intracellular cytokine expression in SA-specific CD4+ T cells. (a) The gating strategy to identify the specific cell-mediated immune responses by intracellular cytokine detection is presented. Flow cytometry was used upon 7 days of in vitro stimulation of PBMCs with the positive and negative controls. Gating was performed on CD4+CellTracelow cells. The numbers in the quadrant gates of the plots denominate each distinct population based on their cytokine (IFN-γ, IL-17, and IL-22) production. The presented results are considered representative of the range of responses obtained for all subjects. TT, tetanus toxoid (positive control). KWC, SA killed whole-cell antigen (positive control). TRAP, malaria thrombospondin-related anonymous protein (negative control). (b-e) Background (medium)-subtracted SA-specific CD4+ T-cell responses from PBMCs from healthy donors (N = 14) in terms of the frequencies of cytokine-producing cells (i.e., IFN-γ+ IL-17− IL-22− [Th1], IL-17+ IFN-γ− [Th17], IFN-γ+ IL-17+ [Th1/Th17] and IL-22+ IFN-γ− IL-17− [Th22] cells) in proliferating CD4+ T cells are presented. Each symbol represents one individual. Lines represent medians. (f) Median IL-17, IFN-γ, and IL-10 concentrations in culture supernatants of KWC-stimulated PBMCs are represented. The KWC-stimulated PBMCs were polyclonally activated, and sorted into populations of SA-specific proliferating CD4+ T cells, non–proliferating CD4+ T cells, and non-CD4+ (CD4−) cells. Results from three independent experiments performed for a total of six donors are shown. LoQ: Limit of Quantification
![Figure 2. Intracellular cytokine expression in SA-specific CD4+ T cells. (a) The gating strategy to identify the specific cell-mediated immune responses by intracellular cytokine detection is presented. Flow cytometry was used upon 7 days of in vitro stimulation of PBMCs with the positive and negative controls. Gating was performed on CD4+CellTracelow cells. The numbers in the quadrant gates of the plots denominate each distinct population based on their cytokine (IFN-γ, IL-17, and IL-22) production. The presented results are considered representative of the range of responses obtained for all subjects. TT, tetanus toxoid (positive control). KWC, SA killed whole-cell antigen (positive control). TRAP, malaria thrombospondin-related anonymous protein (negative control). (b-e) Background (medium)-subtracted SA-specific CD4+ T-cell responses from PBMCs from healthy donors (N = 14) in terms of the frequencies of cytokine-producing cells (i.e., IFN-γ+ IL-17− IL-22− [Th1], IL-17+ IFN-γ− [Th17], IFN-γ+ IL-17+ [Th1/Th17] and IL-22+ IFN-γ− IL-17− [Th22] cells) in proliferating CD4+ T cells are presented. Each symbol represents one individual. Lines represent medians. (f) Median IL-17, IFN-γ, and IL-10 concentrations in culture supernatants of KWC-stimulated PBMCs are represented. The KWC-stimulated PBMCs were polyclonally activated, and sorted into populations of SA-specific proliferating CD4+ T cells, non–proliferating CD4+ T cells, and non-CD4+ (CD4−) cells. Results from three independent experiments performed for a total of six donors are shown. LoQ: Limit of Quantification](/cms/asset/d9cb7948-8373-4d48-a7e1-66f7ddfe7d0d/khvi_a_1613126_f0002_c.jpg)
Figure 3. Plasticity of SA-specific CD4+ T cells. Proliferation and cytokine (IL-17, IFN-γ) production of antigen-specific CD4+ T cells was evaluated by intracellular cytokine staining (ICS). Healthy donor PBMCs were stimulated with a pool of the Th17-driving SA proteins EbhA, IsaA, SdrE (‘Proteins’), and frequencies of responding cells in the CD4+ T cells were assessed in the absence or presence of modulating cytokines, i.e., IL-12/IL-18 or IL-6/IL-1β/IL-23 combinations, or IL-27. Bars represent medians. Each symbol represents one individual. * P< .05; *** P< .001. Cytokine concentrations in culture supernatants assessed using cytometric bead array were found to be consistent with the ICS data (data not shown)
Figure 4. IL-10 production by SA-activated cells. (a) Background (medium) subtracted IL-10 concentrations in supernatants of PBMCs that were cultured overnight with either inactivated SA (killed whole cell antigen; KWC), tetanus toxoid (TT; control) or individual SA antigens, are shown. LoQ: Limit of Quantification. (b) Proliferation and cytokine (IFN-γ, IL-17, IL-10) production of KWC-stimulated cells in the absence or presence of anti-IL-10 antibody are represented. (c) Shown are the background (medium)-subtracted median cytokine (IL-10, IL-17, IFN-γ) concentrations measured in the supernatants of the cells presented in (b). * P< .05; *** P< .001. Each symbol in (a-c) represents one individual
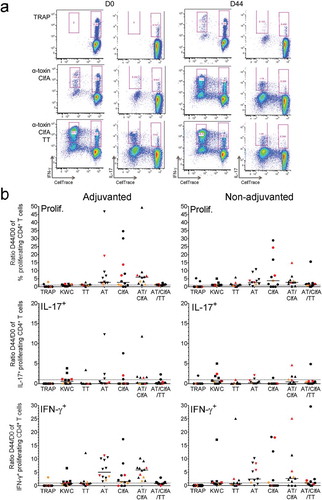
Figure 5. Impact of vaccination on SA-specific memory CD4+ T cells. Proliferation and cytokine production by CD4+ T cells was determined using intracellular cytokine staining and flow cytometry upon 7 days of in vitro stimulation of PBMCs derived from blood samples from vaccinees. Subjects received AS03-adjuvanted or non-adjuvanted multicomponent (CP5/CP8/AT/ClfA) SA candidate vaccine. (a) The gating strategy to identify the specific proliferating (‘CellTrace’-labeled) cytokine-producing CD4+ T cells at pre-vaccination (D0) and two weeks post-dose 2 (D44) in a blood sample from a recipient of AS03-adjuvanted vaccine is presented. Gating was performed on CD4+CellTracelow cells. The numbers in pink font represent the percentage of each distinct population based on its cytokine (IFN-γ, IL-17) production. The presented results are representative of the range of responses seen with all subjects in the analysis. (b) D44/D0 ratios between the background (medium)-subtracted frequencies of all proliferating CD4+ T cells and of IL-17+ and IFN-γ+ proliferating CD4+ T cells are represented for recipients of AS03-adjuvanted or non-adjuvanted vaccine (N = 11 and N = 12, respectively). Each symbol represents one individual, with colors indicating their carrier status at baseline or post-vaccination (non-carrier: black; intermediate carrier: orange; carrier: red). Overall, distributions of non-carriers/intermediate carriers/carriers at baseline were 73/9/18% and 75/17/8% in the non-adjuvanted and AS03-adjuvanted groups, respectively. The distributions of non-carriers/carriers at D30 were 82/11% and 83/17% in the non-adjuvanted and AS03-adjuvanted groups, respectively. Solid lines represent medians. Dotted lines represent the limit of quantitation. KWC, inactivated SA ‘killed whole cell’ control antigen. TT, tetanus toxoid (positive control). Prolif, proliferation