
Figures & data
Table 1. Percentages of CD14+, CD16+, CD119+, CD124+, CD197+ cells in non-activated Mc/Mph cell cultures
Figure 1. Histograms of staining for CD197+ Mc/Mph
1 – Mc/Mphs in the absence of GM-CSF;2 – Mc/Mphs in the presence of GM-CSF.
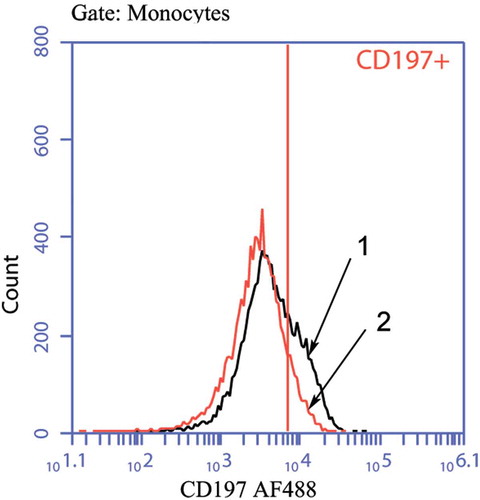
Table 2. Percentages of CD14+, CD16+, CD119+, CD124+, CD197+ cells in LPS-activated Mc/Mph cell cultures
Figure 2. Histograms of staining for CD14+, CD16+, CD119+, and CD197+ Mc/Mphs
1 – Mc/Mphs activated by LPS in the absence of GM-CSF;2 – Mc/Mphs activated by LPS in the presence of GM-CSF.
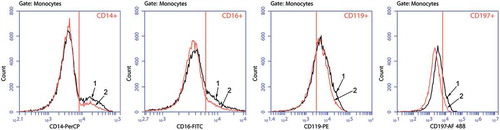
Table 3. Concentrations of cytokines (pg/ml) in Mc/Mph cell culture supernatants
Table 4. Percentages of CD38+ T cells in T cell subpopulations studied
Table 5. Cytokine concentrations in T cell culture supernatants (pg/ml)