
Figures & data
Figure 1. Preparation of anti-ETA IgGs
A. Distribution of the concentration of anti-ETA antibodies in 320 donors. The histogram represents the percentage of sera classified. B. Classification of sera. Sera were classified into three groups according to the concentration of anti-ETA antibodies, namely, high (H), medium (M) and low (L). The horizontal line represents the concentration of anti-ETA antibodies in the sera. C. Purified anti-ETA IgGs showed neutralizing activities in vitro. The horizontal line represents the OD450 when measuring the cell death via a CCK-8 kit. Rab indicates the rabbit anti-ETA-IgGs. “*” indicates P < .05 while “n.s.” indicates no statistical significance (P > .05).
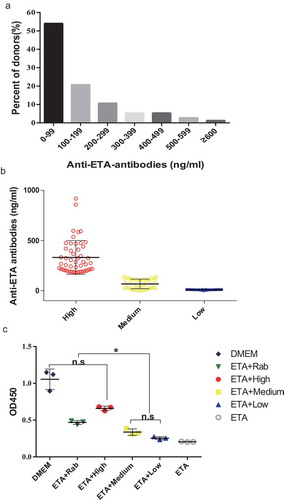
Figure 2. Prophylactic protection against PA infection of anti-ETA IgGs
Survival rates of mice challenged with a lethal dose of PA103. Mice were administered IgGs purified from sera containing high-, medium- and low- titers of ETA-specific antibodies in advance (5 mg per mouse). One hour later, the mice were challenged with a lethal dose of PA103. The number of survivors was recorded every 12 hours for 5 days. PBS was used as a negative control. B. Weight change of mice challenged with a sublethal dose of PA103. Mice were administered the purified IgGs one hour prior to challenge. The percentage of their initial weight is shown. C. Body temperature change in mice challenged with a sublethal dose of PA103. Mice were administered the purified IgGs one hour prior to challenge. Thehorizontal line represents the body temperature. D. The bacterial load in the lung of mice challenged with a sublethal dose of PA103. Mice were administered purified IgGs one hour prior to challenge. The log values of the number of bacteria per gram of lung are shown. E&F. Evaluation of the inflammatory response after a sublethal dose of PA103. The horizontal line represents the concentration of proinflammatory cytokines IL-1β (E) and TNF-α (F). G. HE staining of lungs from mice 24 hours after infection with a sublethal dose of PA 103. Images were captured at 100× magnification. H. Semiquantification of lung inflammation in infected mice. The horizontal line represents the mean and SD of the inflammation score of the lung according to the change in HE staining in the lung sections. High indicates high level anti-hu ETA-IgG, Medium indicates medium level anti-hu ETA-IgG, Low indicates low level anti-hu ETA-IgG, Rab indicates rabbit anti-ETA IgGs and Non-rab indicates non-specific IgGs. “*” indicates P < .05, while “n.s.” indicates no statistical significance (P > .05).
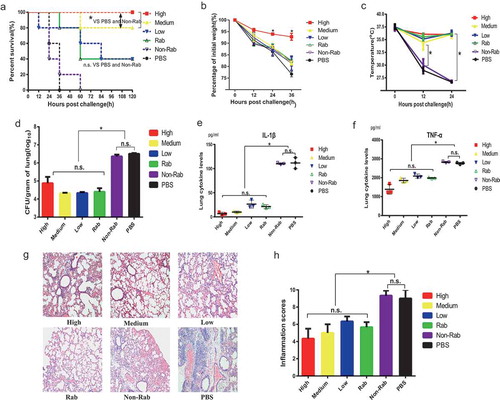
Figure 3. Prophylactic protection against ETA toxemia of anti-ETA IgGs
A. Survival rates of mice challenged with a lethal dose of ETA. Five mg of purified IgG were incubated with 0.4 μg of ETA. Then, the mixture was intraperitoneally administered to each mouse. The number of survivors was recorded every 12 hours for 5 days. PBS was used as a negative control. Polyclonal rabbit anti-ETA IgGs were used as a positive control. B. Weight change of mice challenged with a sublethal dose of ETA after incubation with anti-ETA IgGs. The percentage of their initial weight is shown. C. Body temperature change in mice challenged with a sublethal dose of ETA after incubation with anti-ETA IgGs. The horizontal line represents the body temperature. D&E. Evaluation of the inflammation response in liver after a sublethal dose of ETA after incubation with anti-ETA IgGs. The horizontal line represents the concentration of proinflammatory cytokines IL-1β (D) and TNF-α (E). F. HE staining of livers from mice 24 hours after infection with a sublethal dose of ETA after incubation with anti-ETA IgGs. Images were captured at 400× magnification, and the arrows indicate the acidophilic (Councilman) bodies. G. Semiquantification of liver inflammation in challenged mice. The horizontal line represents the mean and SE of the inflammation score of the liver according to the change in HE staining in the liver sections. High indicates high level anti-hu ETA-IgG, Medium indicates medium level anti-hu ETA-IgG, Low indicates low level anti-hu ETA-IgG, Rab indicates rabbit anti-ETA IgGs and Non-rab indicates non-specific IgGs. “*” indicates P < .05, while “n.s.” indicates no statistical significance (P > .05).
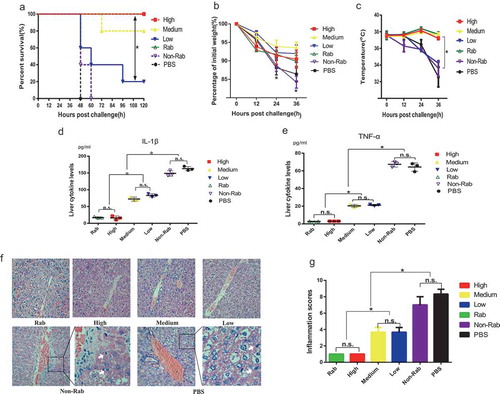
Figure 4. Therapeutic protection against PA infection of anti-ETA IgGs
A. Survival rates of mice challenged with a lethal dose of PA103. Mice were administered ETA-specific IgGs 3 hours after bacterial infection (5 mg IgGs per mouse). The number of survivors was recorded every 12 hours for 5 days. Ceftazidime was used as a positive control. B. Weight change in mice challenged with a sublethal dose of PA103. Mice were administered the purified IgGs 3 hours after the challenge. The percentage of their initial weight is shown. C. Body temperature change in mice challenged with a sublethal dose of PA103. Mice were administered the purified IgGs 3 hours after the challenge. The horizontal line represents the body temperature. D. The bacterial load in the lung of mice challenged with a sublethal dose of PA103. Mice were administered purified IgGs 3 hours after the challenge. The log values of the number of bacteria per gram of lung are shown. E&F. Evaluation of the inflammation response in lungs after a sublethal dose of PA103. The horizontal line represents the concentration of proinflammatory cytokines IL-1 β (E) and TNF-α (F). G. HE staining of lungs from mice 24 hours after infection with a sublethal dose of PA 103. Images were captured at 100× magnification. H. Semiquantification of lung inflammation in infected mice. The horizontal line represents the mean and SE of the inflammation score of the lung according to the change in HE staining in the lung sections. High indicates high level anti-hu ETA-IgG, Medium indicates medium level anti-hu ETA-IgG, Low indicates low level anti-hu ETA-IgG, Rab indicates rabbit anti-ETA IgGs and Non-rab indicates non-specific IgGs. “*” indicates P < .05 while “n.s.” indicates no statistical significance (P > .05).
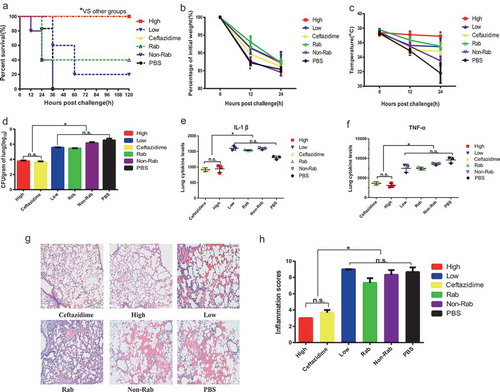
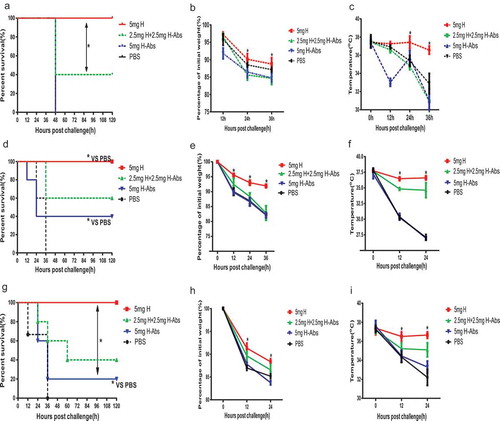
Figure 5. Anti-ETA IgGs mediated protections depends on ETA specific antibodies
A. Survival rates of mice challenged with a lethal dose of ETA. Five mg of purified High-level anti-ETA IgGs (H), GST-ETA absorbed IgGs (H-Abs) and a mixture of the two IgGs were incubated with 0.4 μg of ETA, respectively. Then, the mixture was intraperitoneally administered to each mouse. The number of survivors was recorded every 12 hours for 5 days. PBS was used as a negative control. B. Weight change of mice challenged with a sublethal dose of ETA after incubation with High-level anti-ETA IgGs (H), GST-ETA absorbed IgGs (H-Abs) and a mixture of the two IgGs. The percentage of their initial weight is shown. C. Body temperature change in mice challenged with a sublethal dose of ETA after incubation with purified High-level anti-ETA IgGs (H), GST-ETA absorbed IgGs (H-Abs) and a mixture of the two IgGs. The horizontal line represents the body temperature. D. Survival rates of mice challenged with a lethal dose of PA103. Mice were administered High-level anti-ETA IgGs (H), GST-ETA absorbed IgGs (H-Abs) and a mixture of the two IgGs one hour before the challenge of PA103. E. Weight change of mice challenged with a sublethal dose of PA103. Mice were administered the above IgGs one hour prior to challenge. The percentage of their initial weight is shown. F. Body temperature change in mice challenged with a sublethal dose of PA103. Mice were administered the High-level anti-ETA IgGs (H), GST-ETA absorbed IgGs (H-Abs) and a mixture of the two IgGs one hour before the challenge of PA103. G. Survival rates of mice challenged with a lethal dose of PA103. Mice were administered IgGs three hours after PA103 infection. The IgGs were High-level anti-ETA IgGs (H), GST-ETA absorbed IgGs (H-Abs) and a mixture of the two IgGs. H. Weight change in mice challenged with a sublethal dose of PA103. IgGs were administrated three hours after the challenge. The percentage of their initial weight is shown. I. Body temperature change in mice challenged with a sublethal dose of PA103. IgGs were administrated three hours after the challenge. The horizontal line represents the body temperature. “*” indicates statistical significance (P < .05).
Supplemental material